Table of Contents
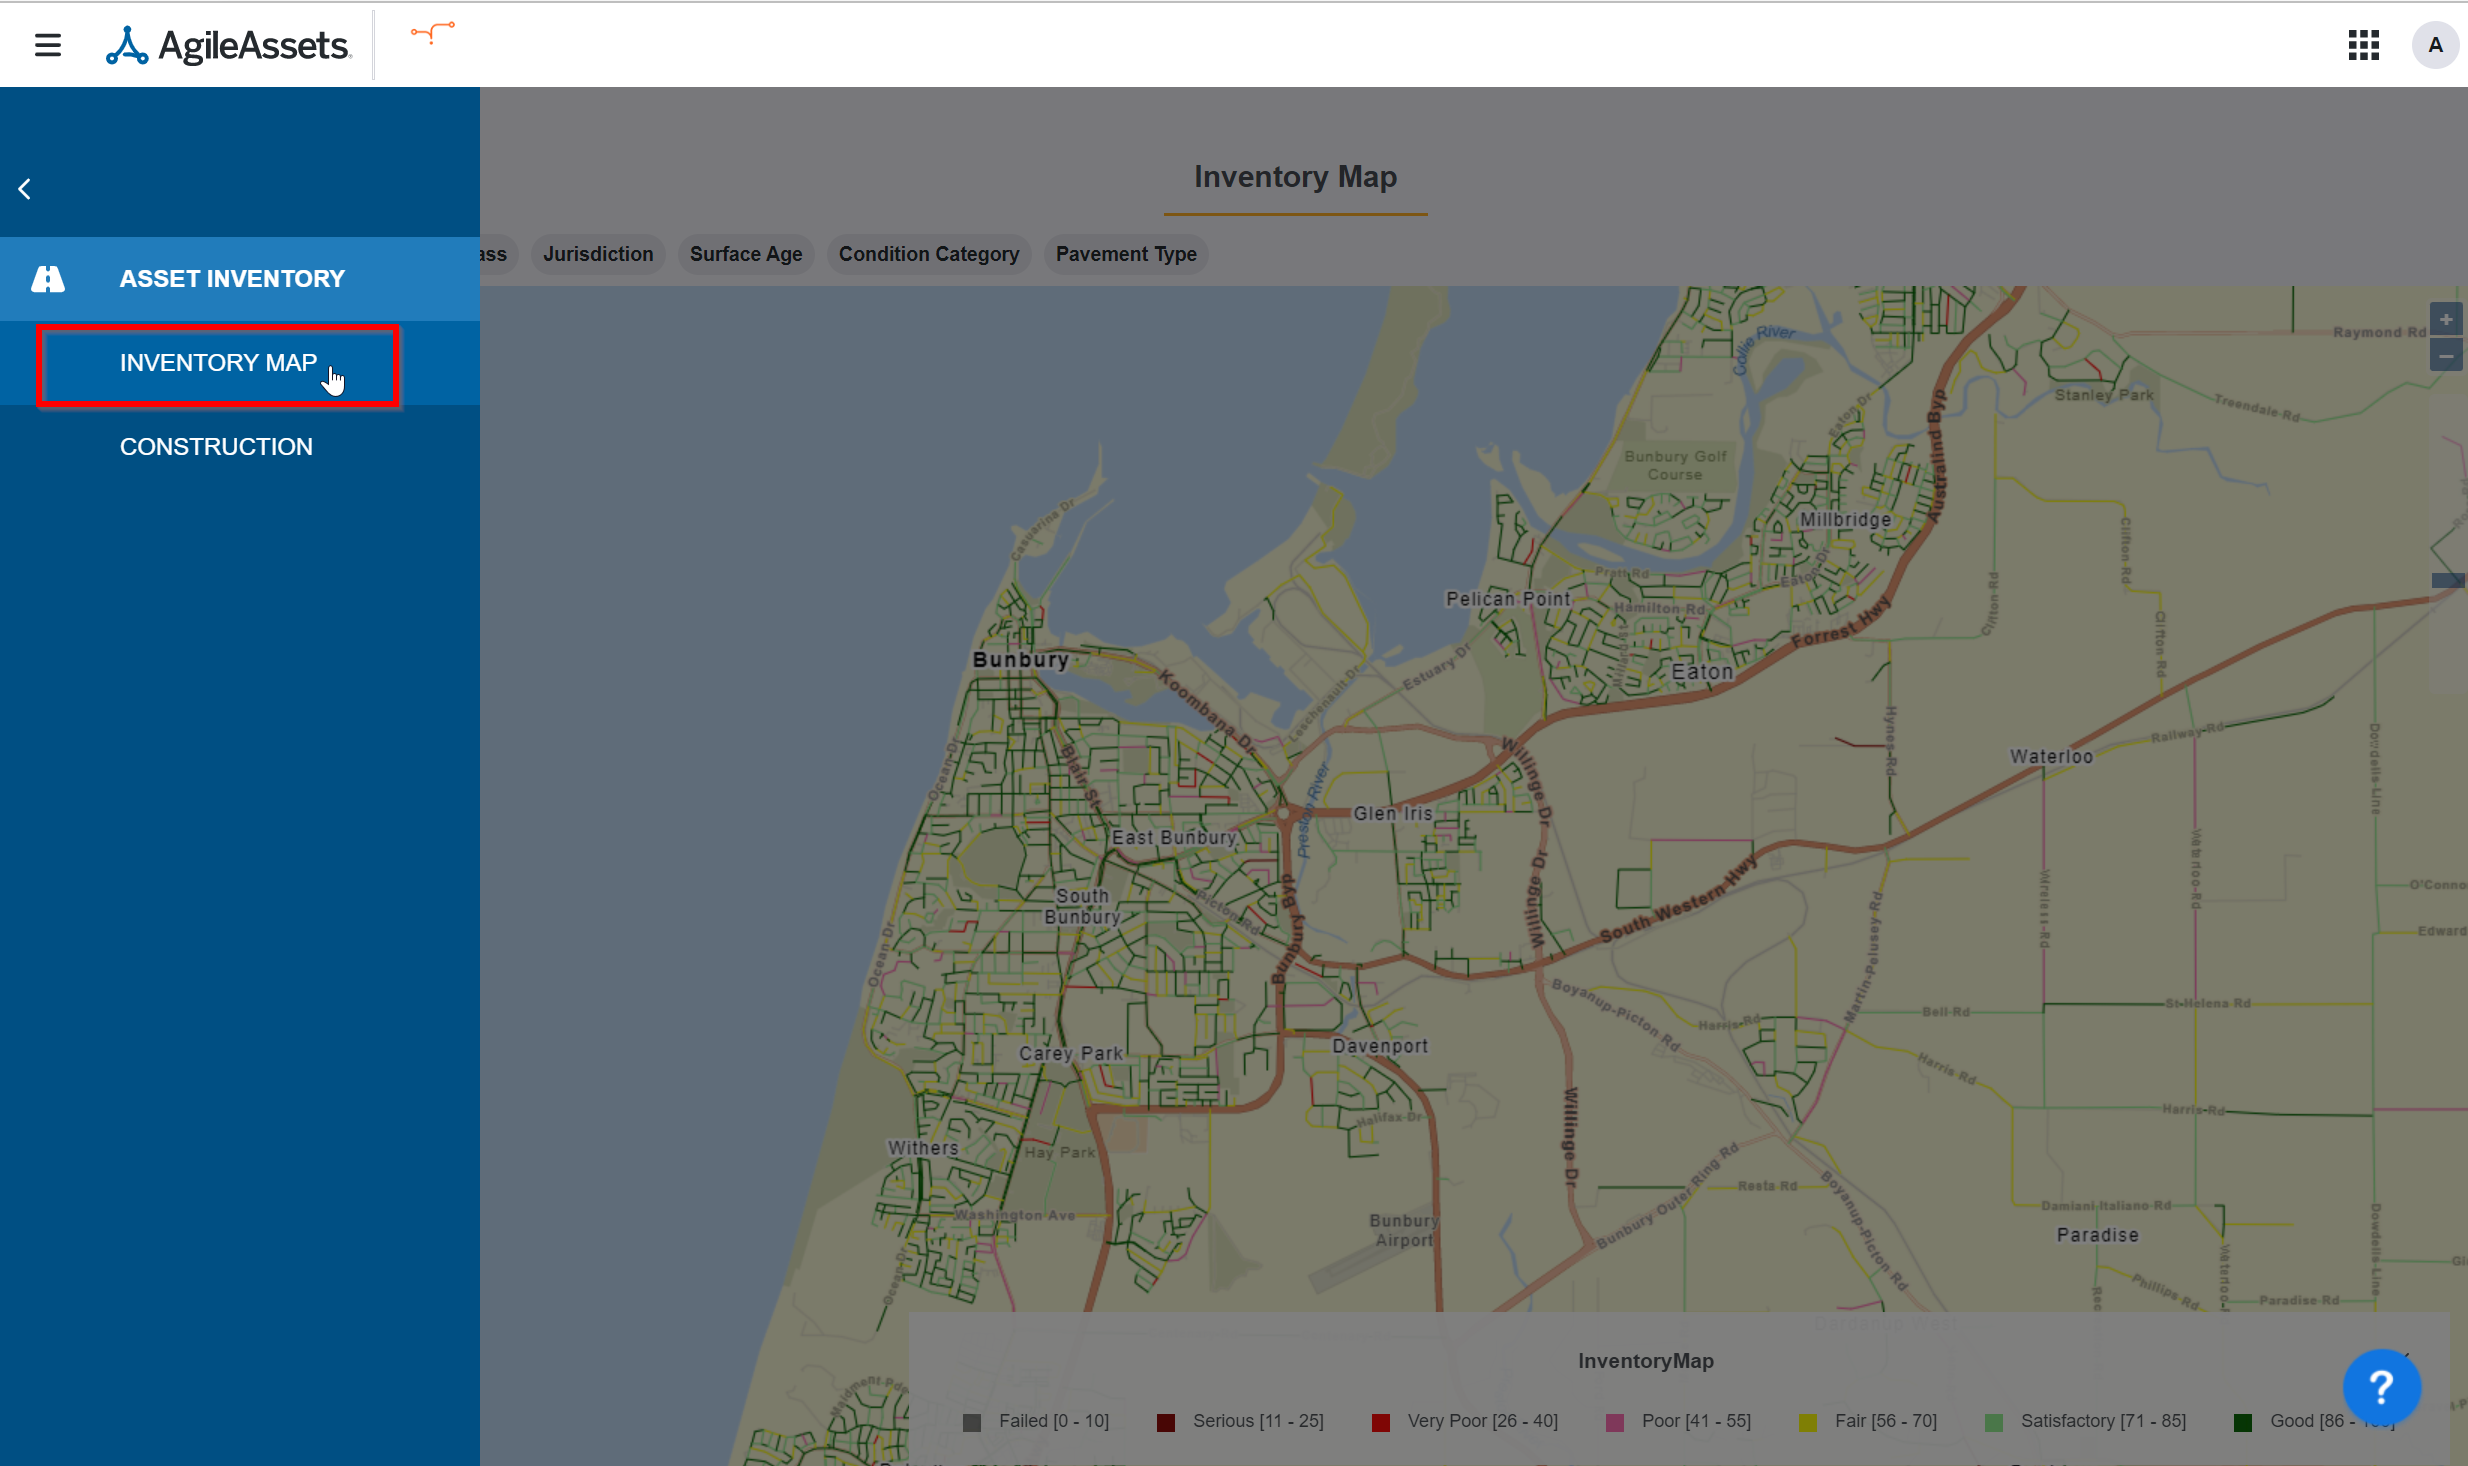
Inventory Map
The Inventory Map window gives user the ability to see what is happening within their road networks. Public work administrators with the right security credentials are now able to review pavement information and determine roads conditions such as: Problem Spots, PCI percentage, Surface Age, Average Daily Traffic, etc. on the fly. The Inventory map interface also displays the legend of how PCI (pavement condition) is broken by color at the bottom of the window.
The Inventory Map window also provides filters (Average Daily Traffic, Functional Class, Jurisdiction, Surface Age, Condition Category, Pavement Type) that user can choose from to get results that is instantly displayed on the map giving you the ability to view your network spatially.
Viewing Inventory Information
- To view pavement inventory data in Pavement Express, you must first login to the application.
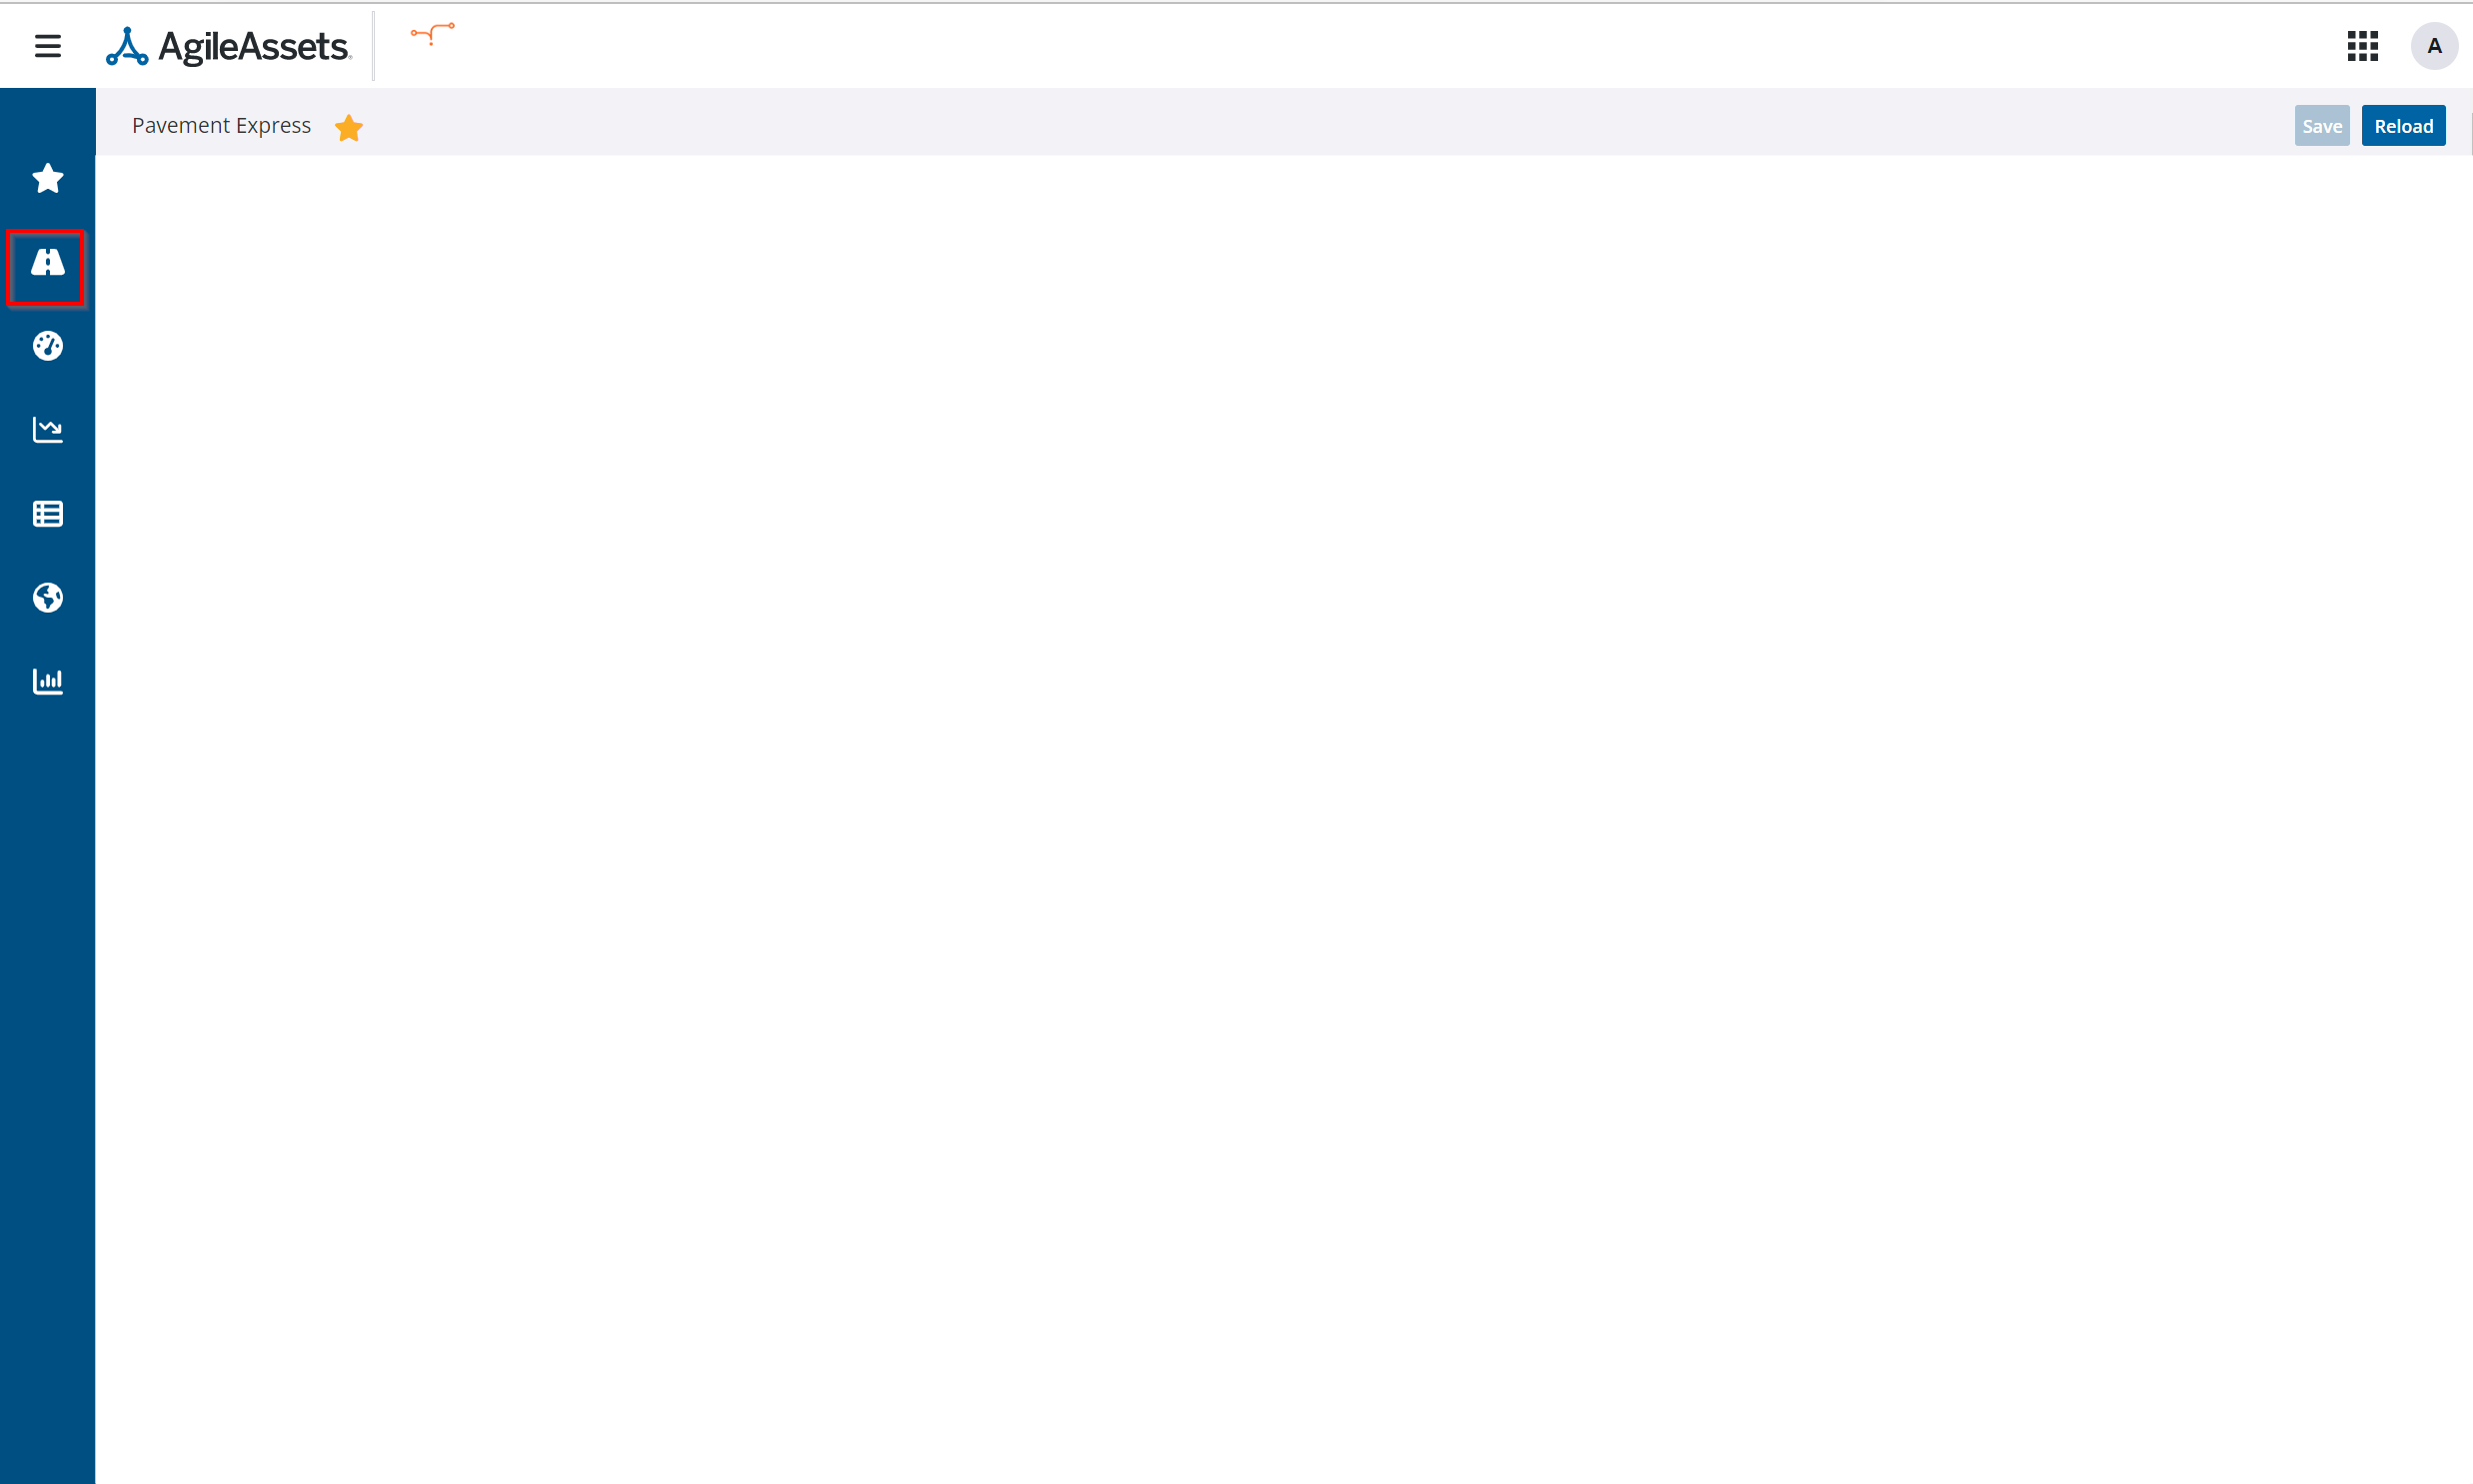
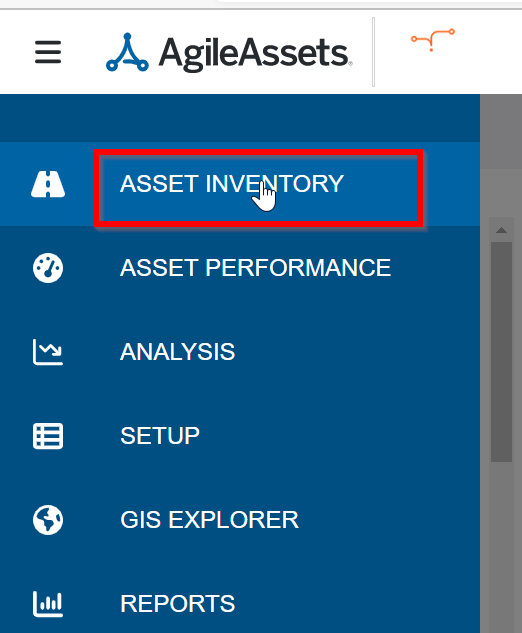
- From the Pavement Express default page, hover your mouse over the ASSET INVENTORY icon (in the upper left-hand pane) to bring up the menu list and then click on ASSET INVENTORY.
- Click on the INVENTORY MAP sub-menu to open the Inventory Map window.
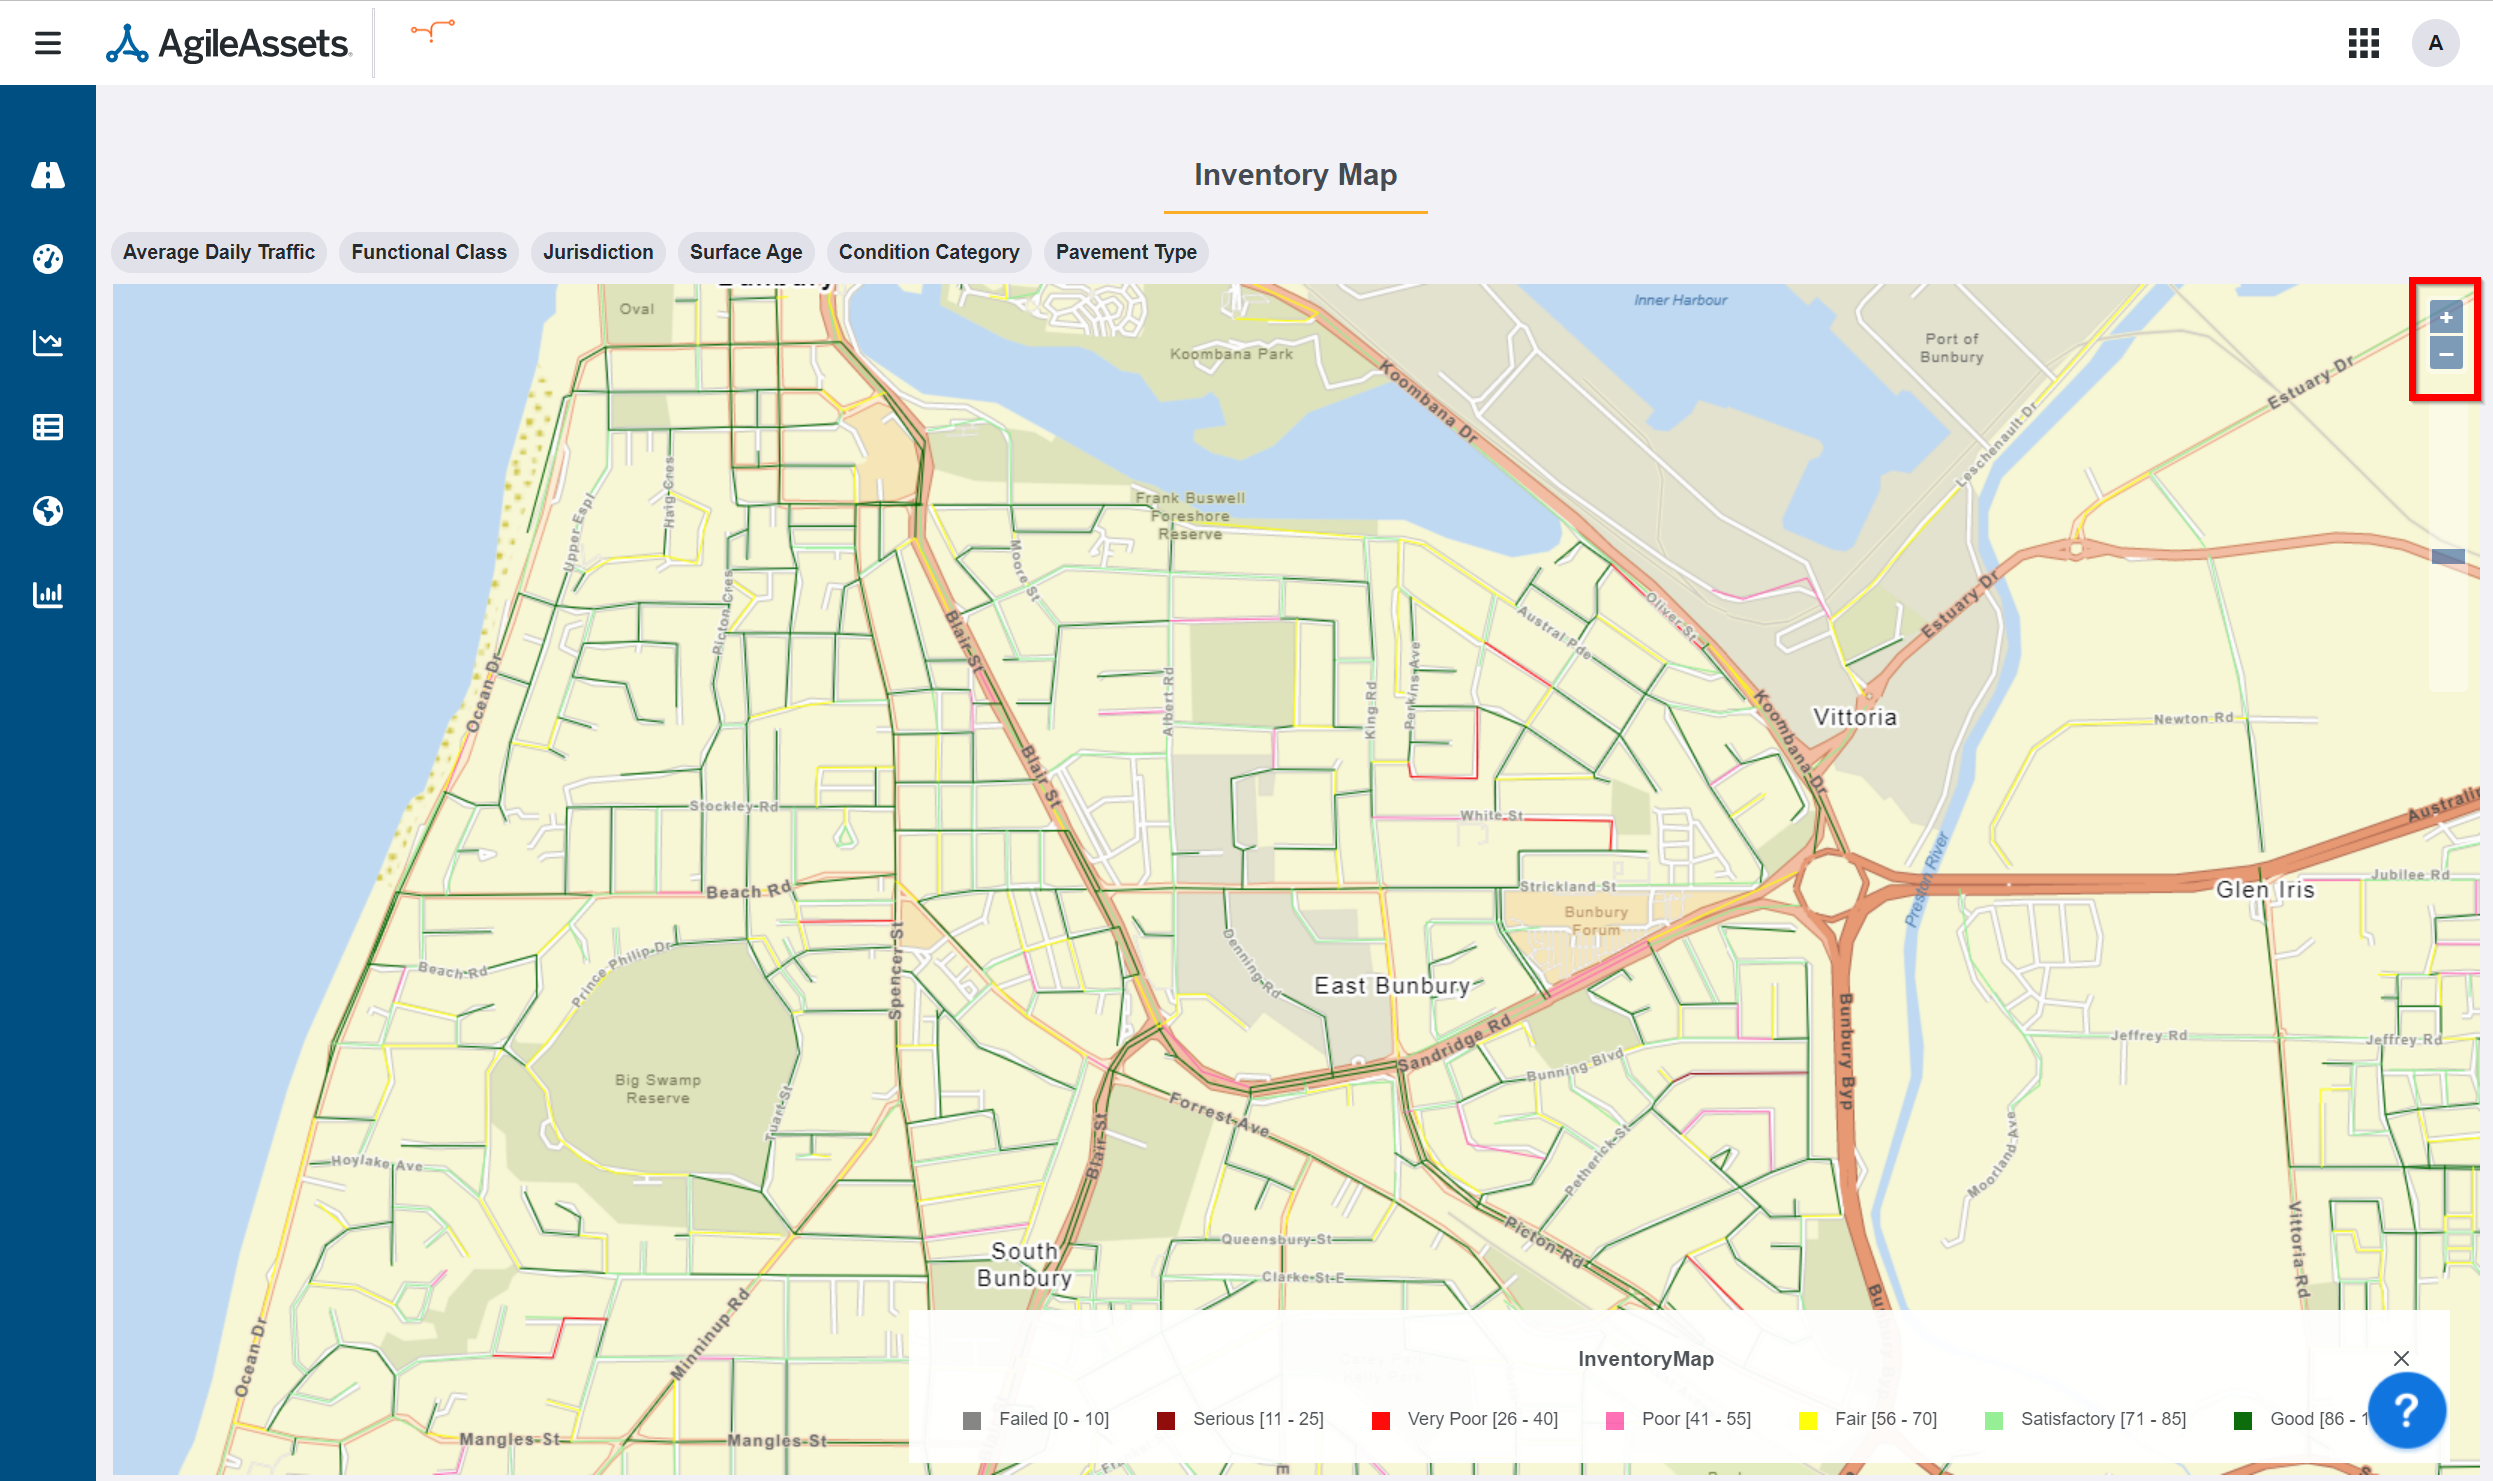
4. Click the Plus icon ![]() in the upper right-hand corner of the page to zoom into the area of interest.
in the upper right-hand corner of the page to zoom into the area of interest.
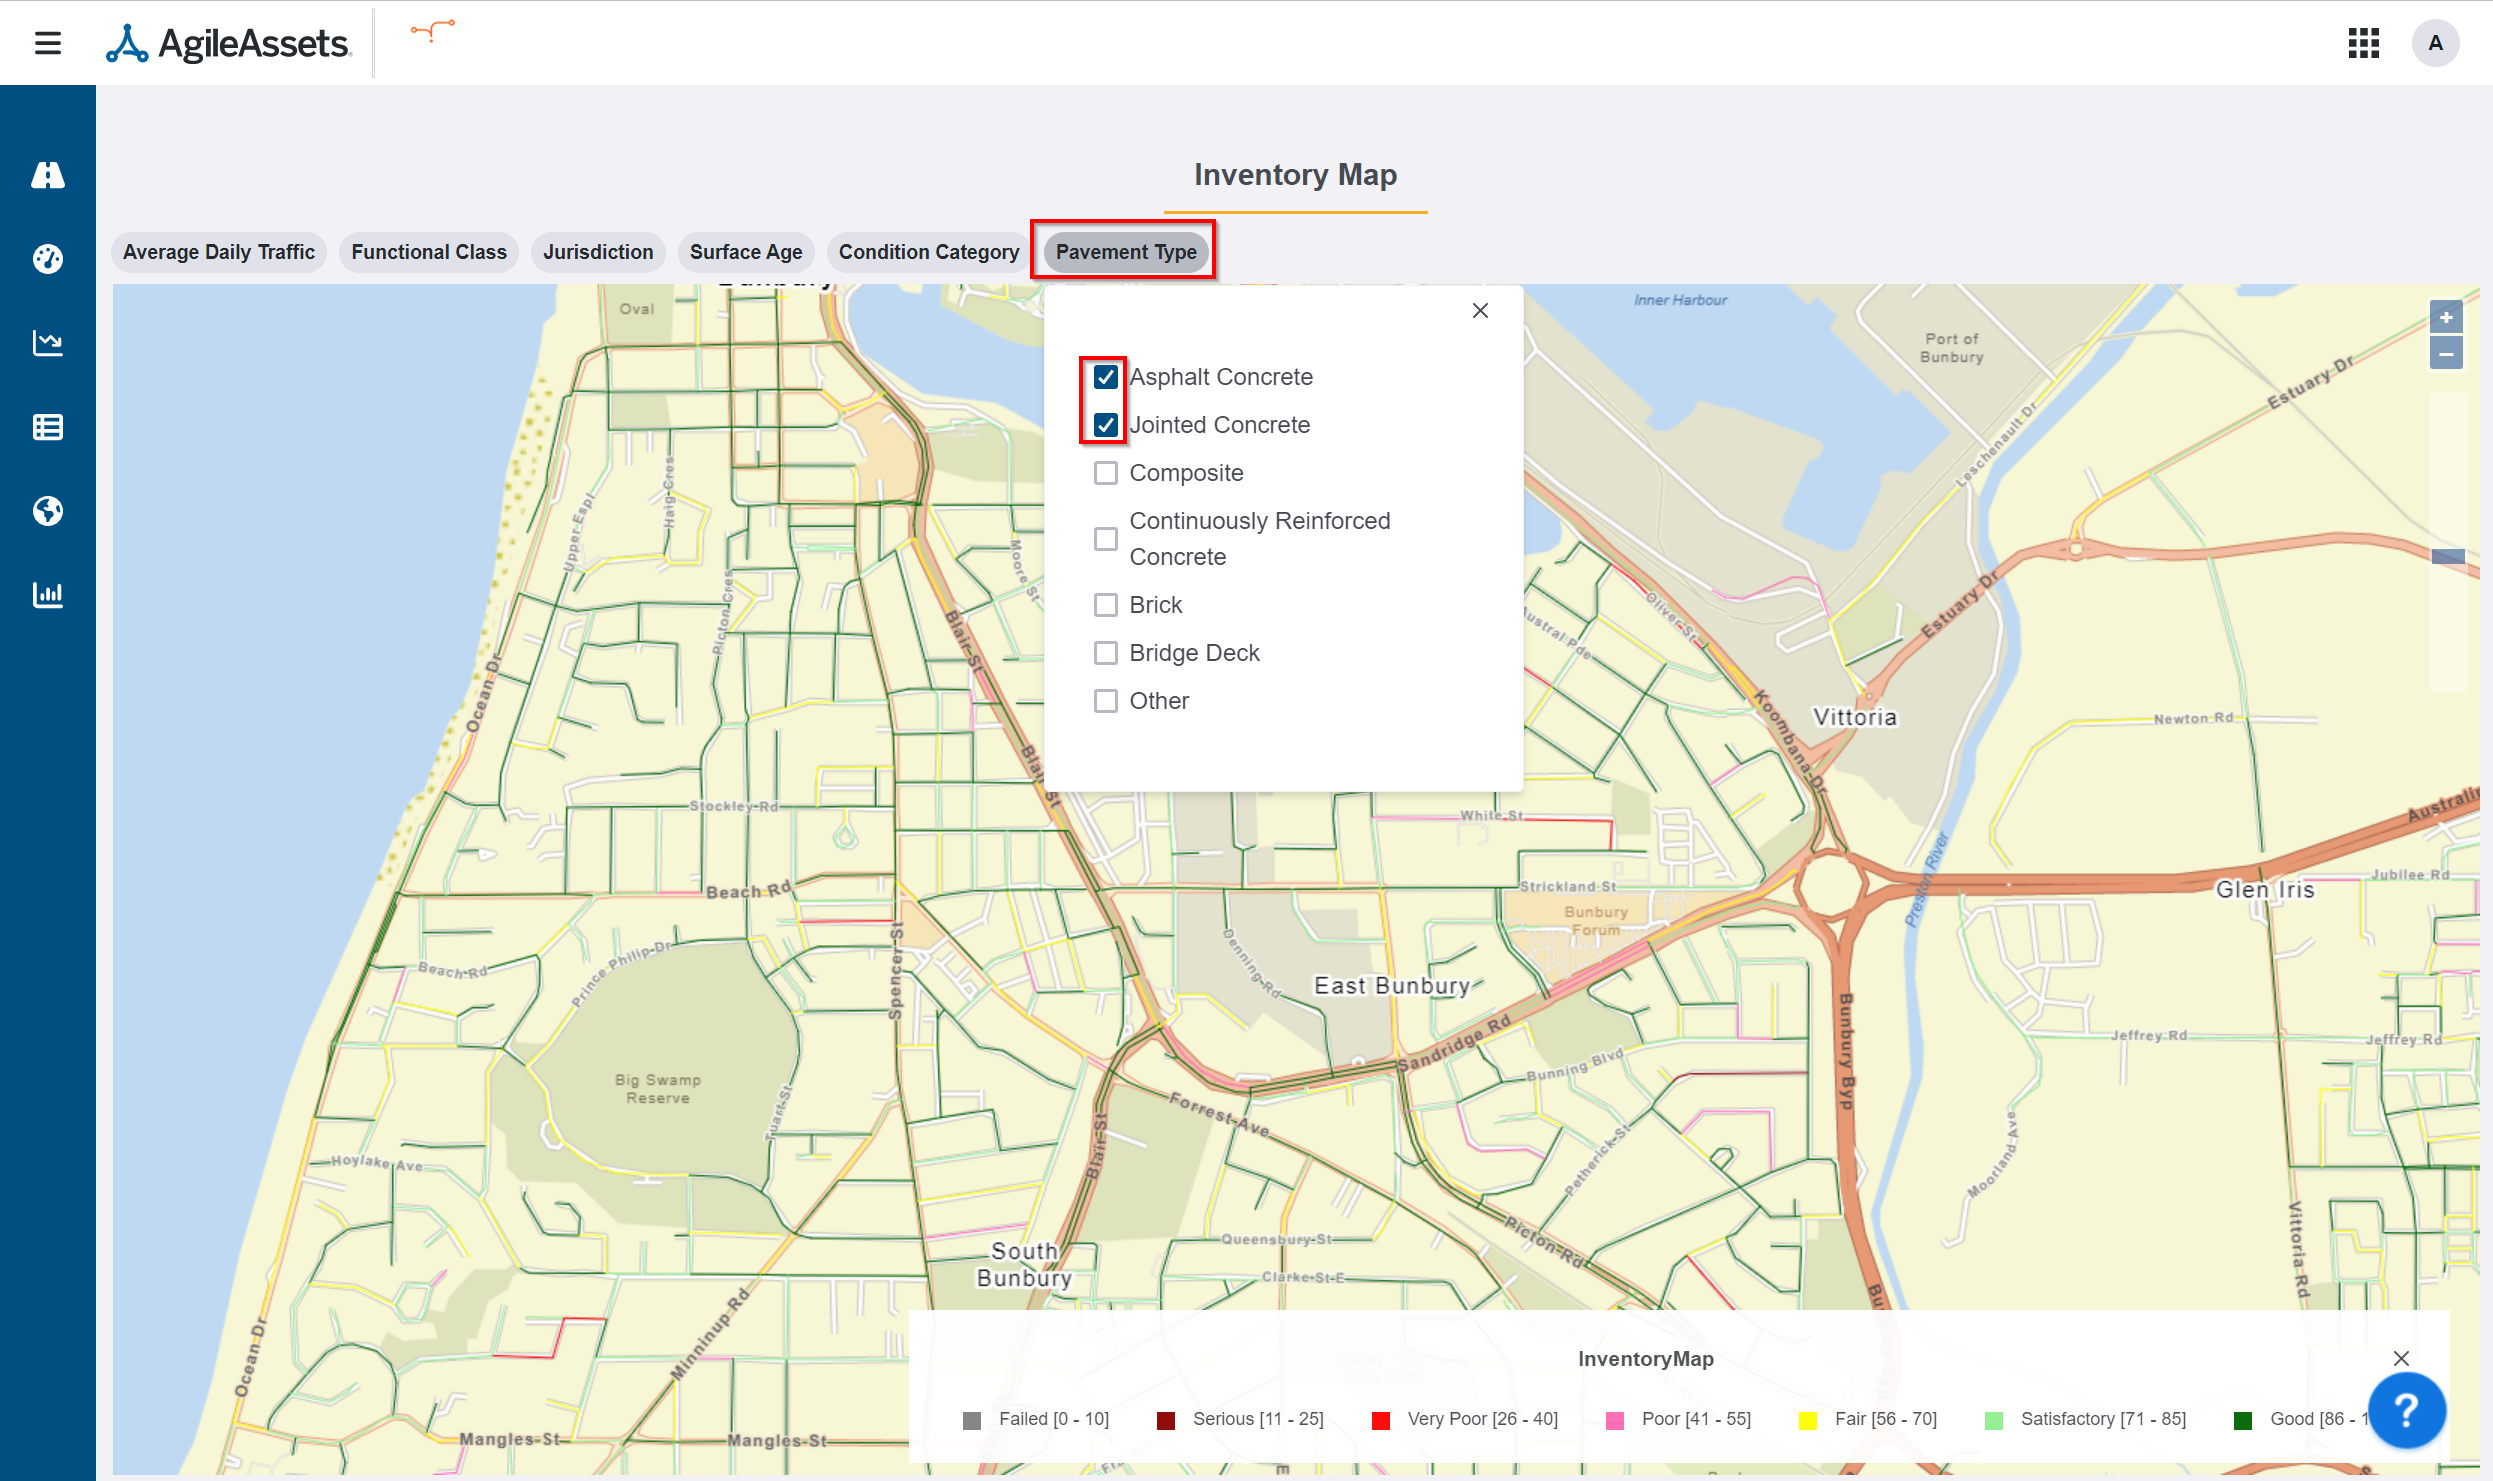
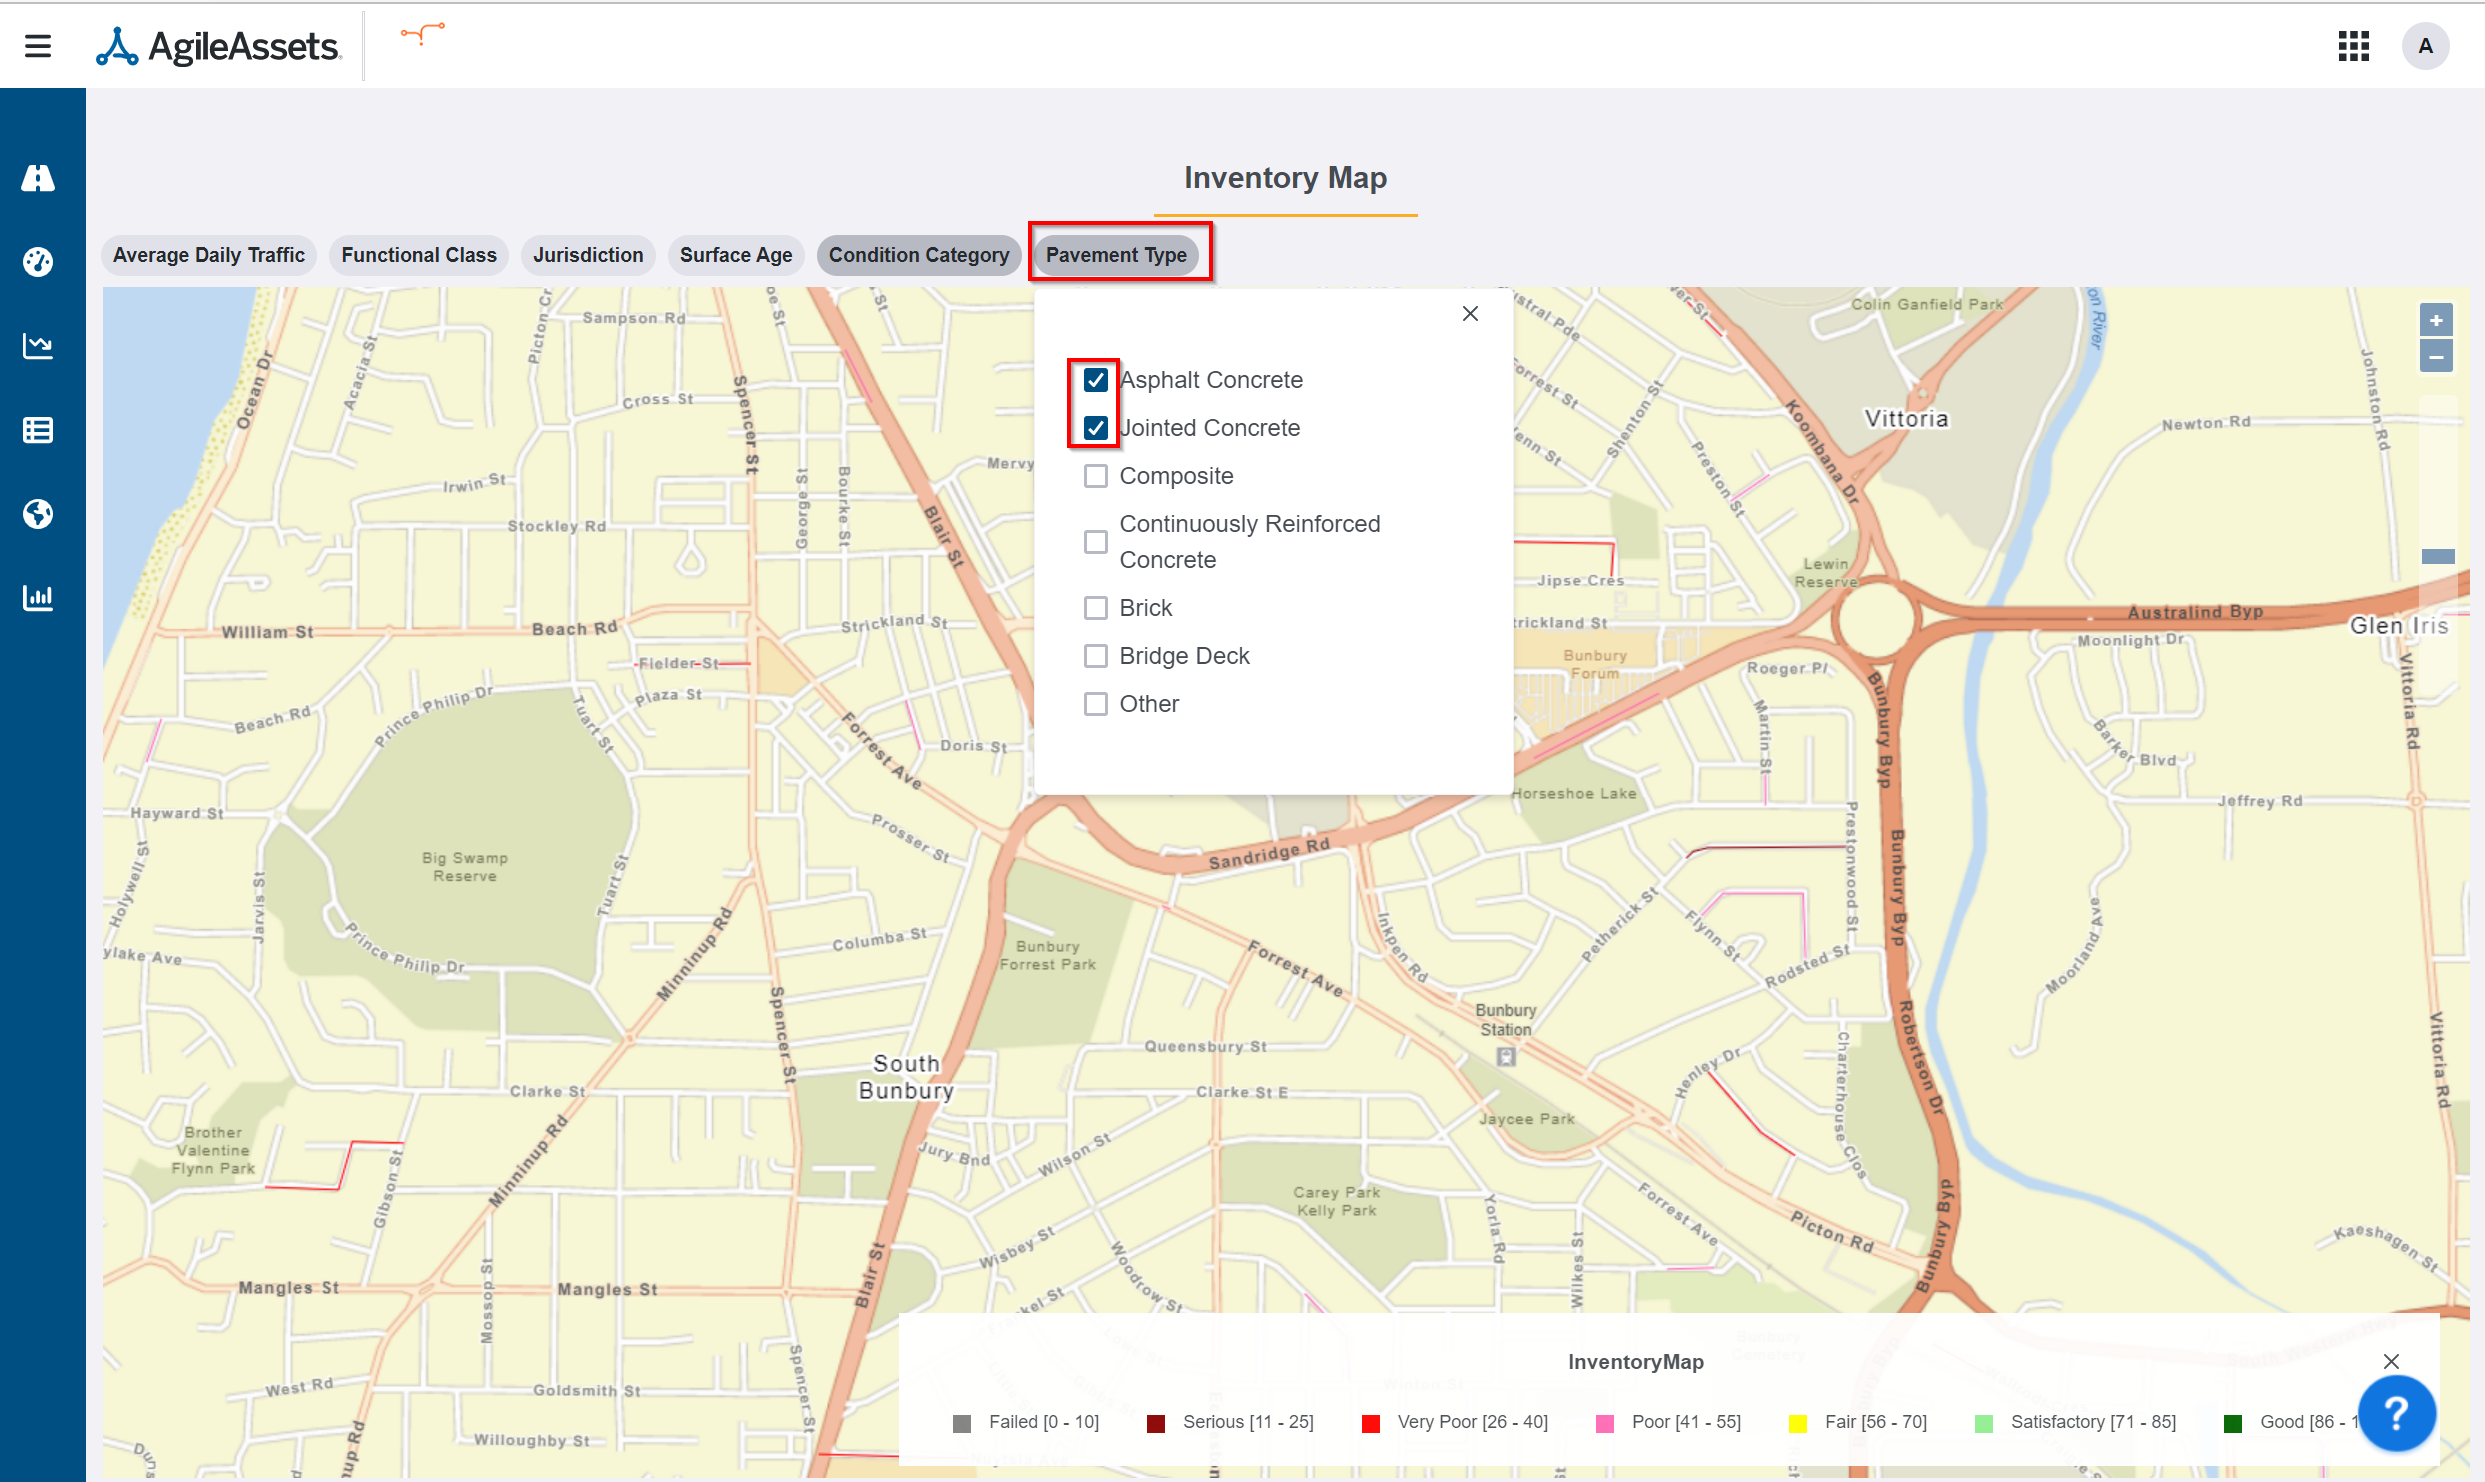
5. Click on Pavement Type (filter) button to bring up the pavement options then select the pavement types of interest by clicking the checkboxes adjacent to the pavement names. You can also de-select pavement types by unchecking the checkboxes adjacent to the pavement names.
| Note |
|---|
The map simultaneously refreshes and updates the results as your selections are made. |
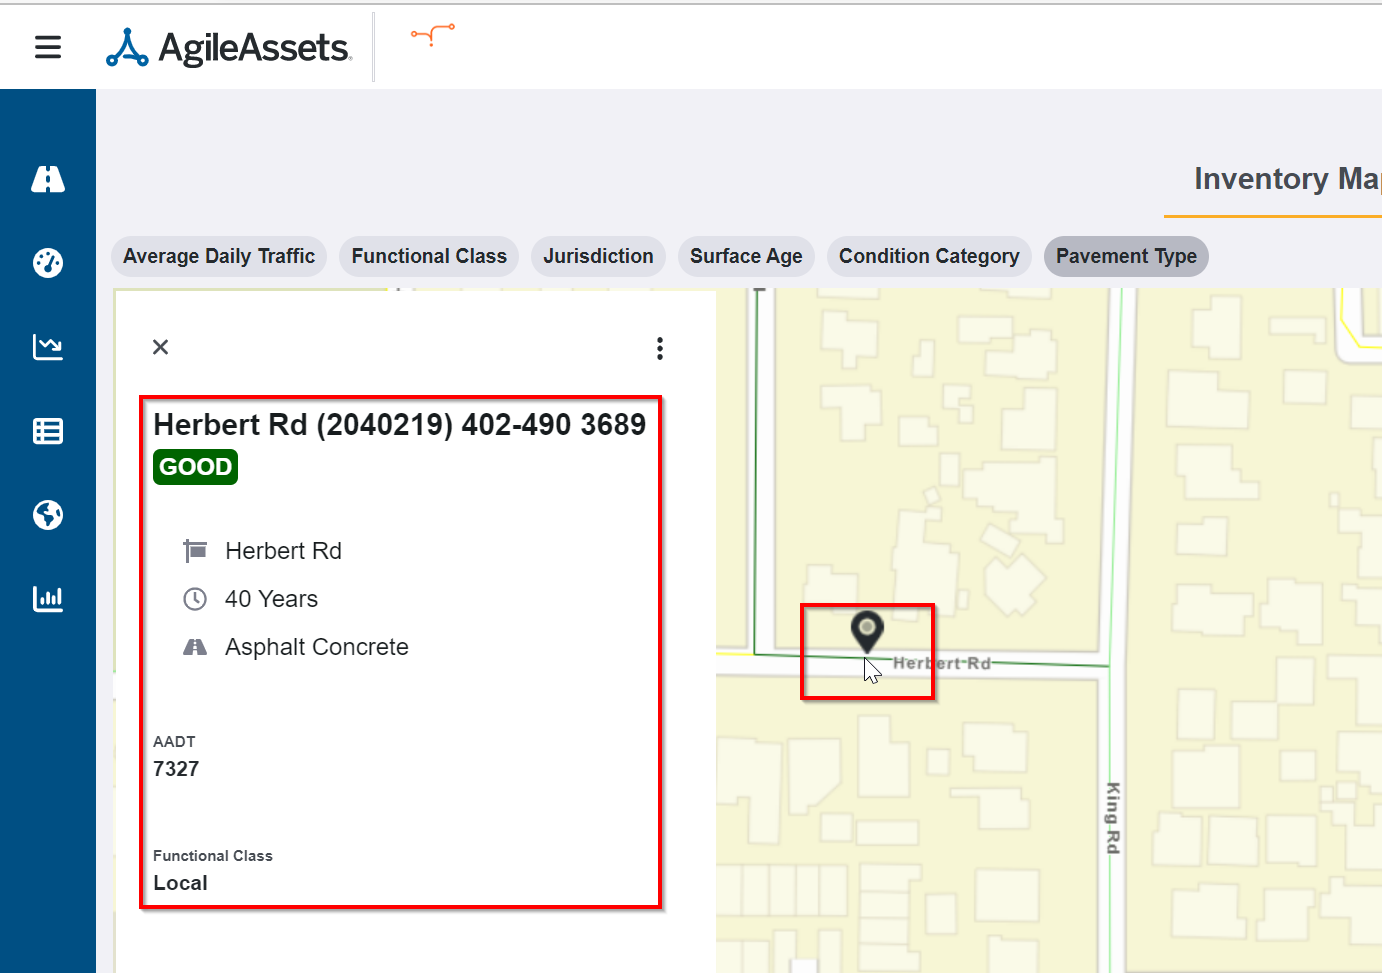
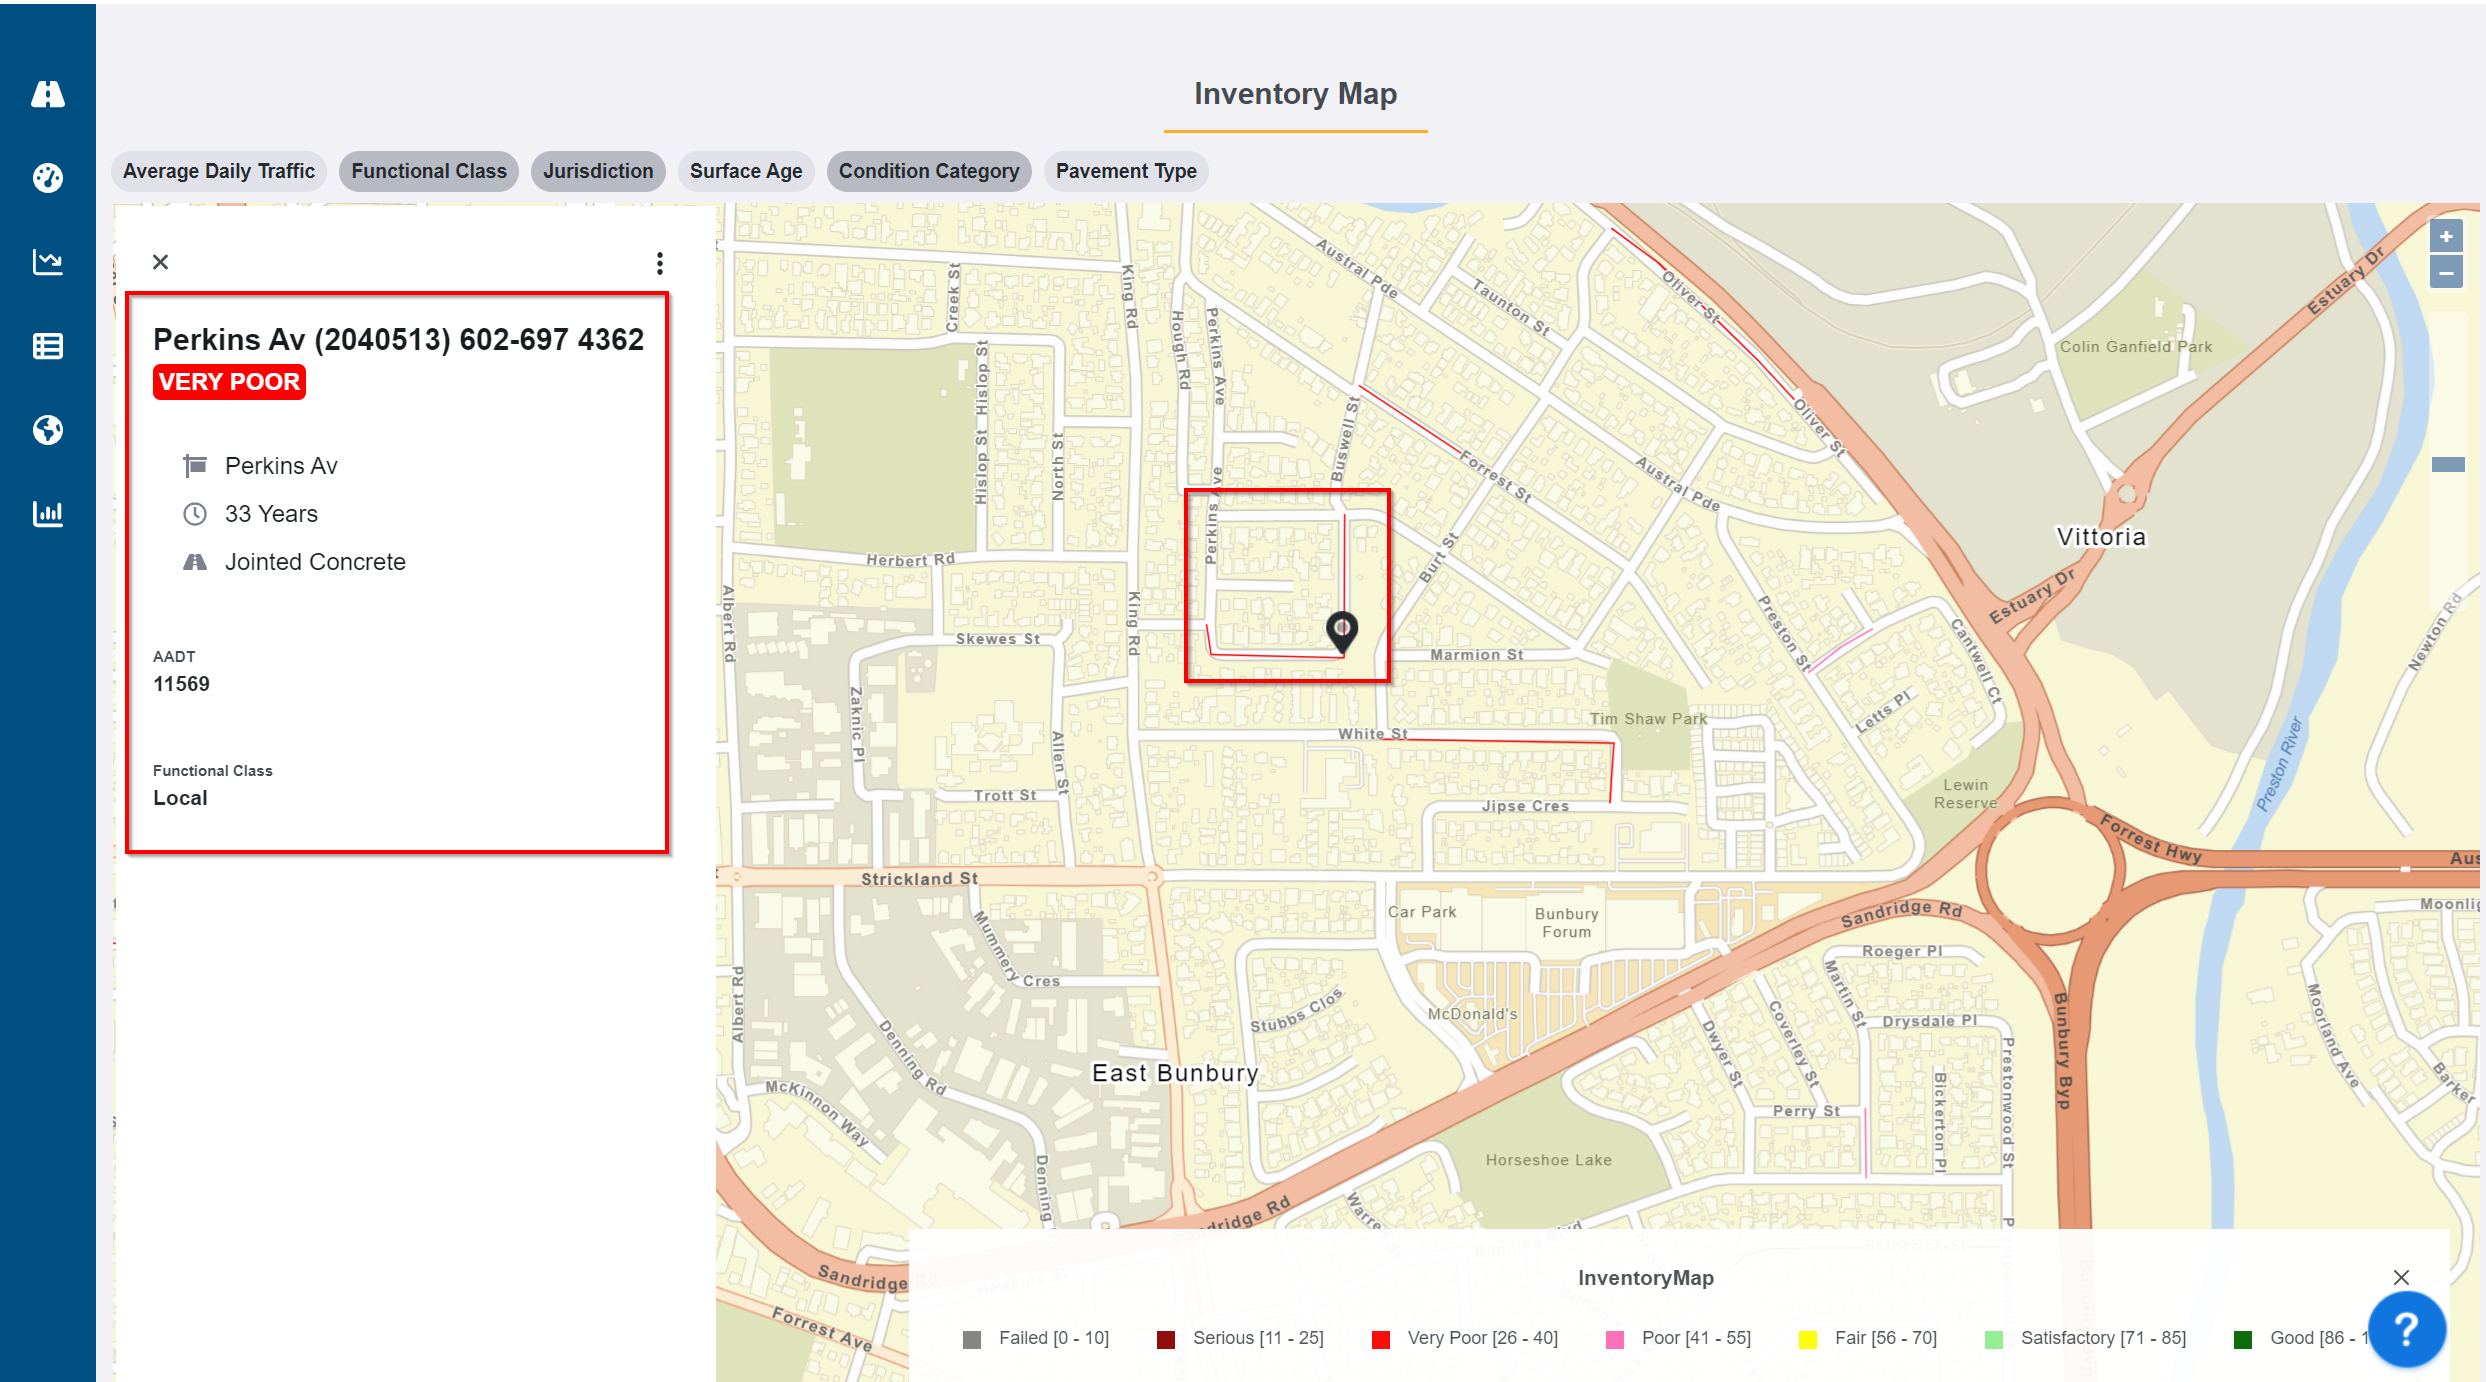
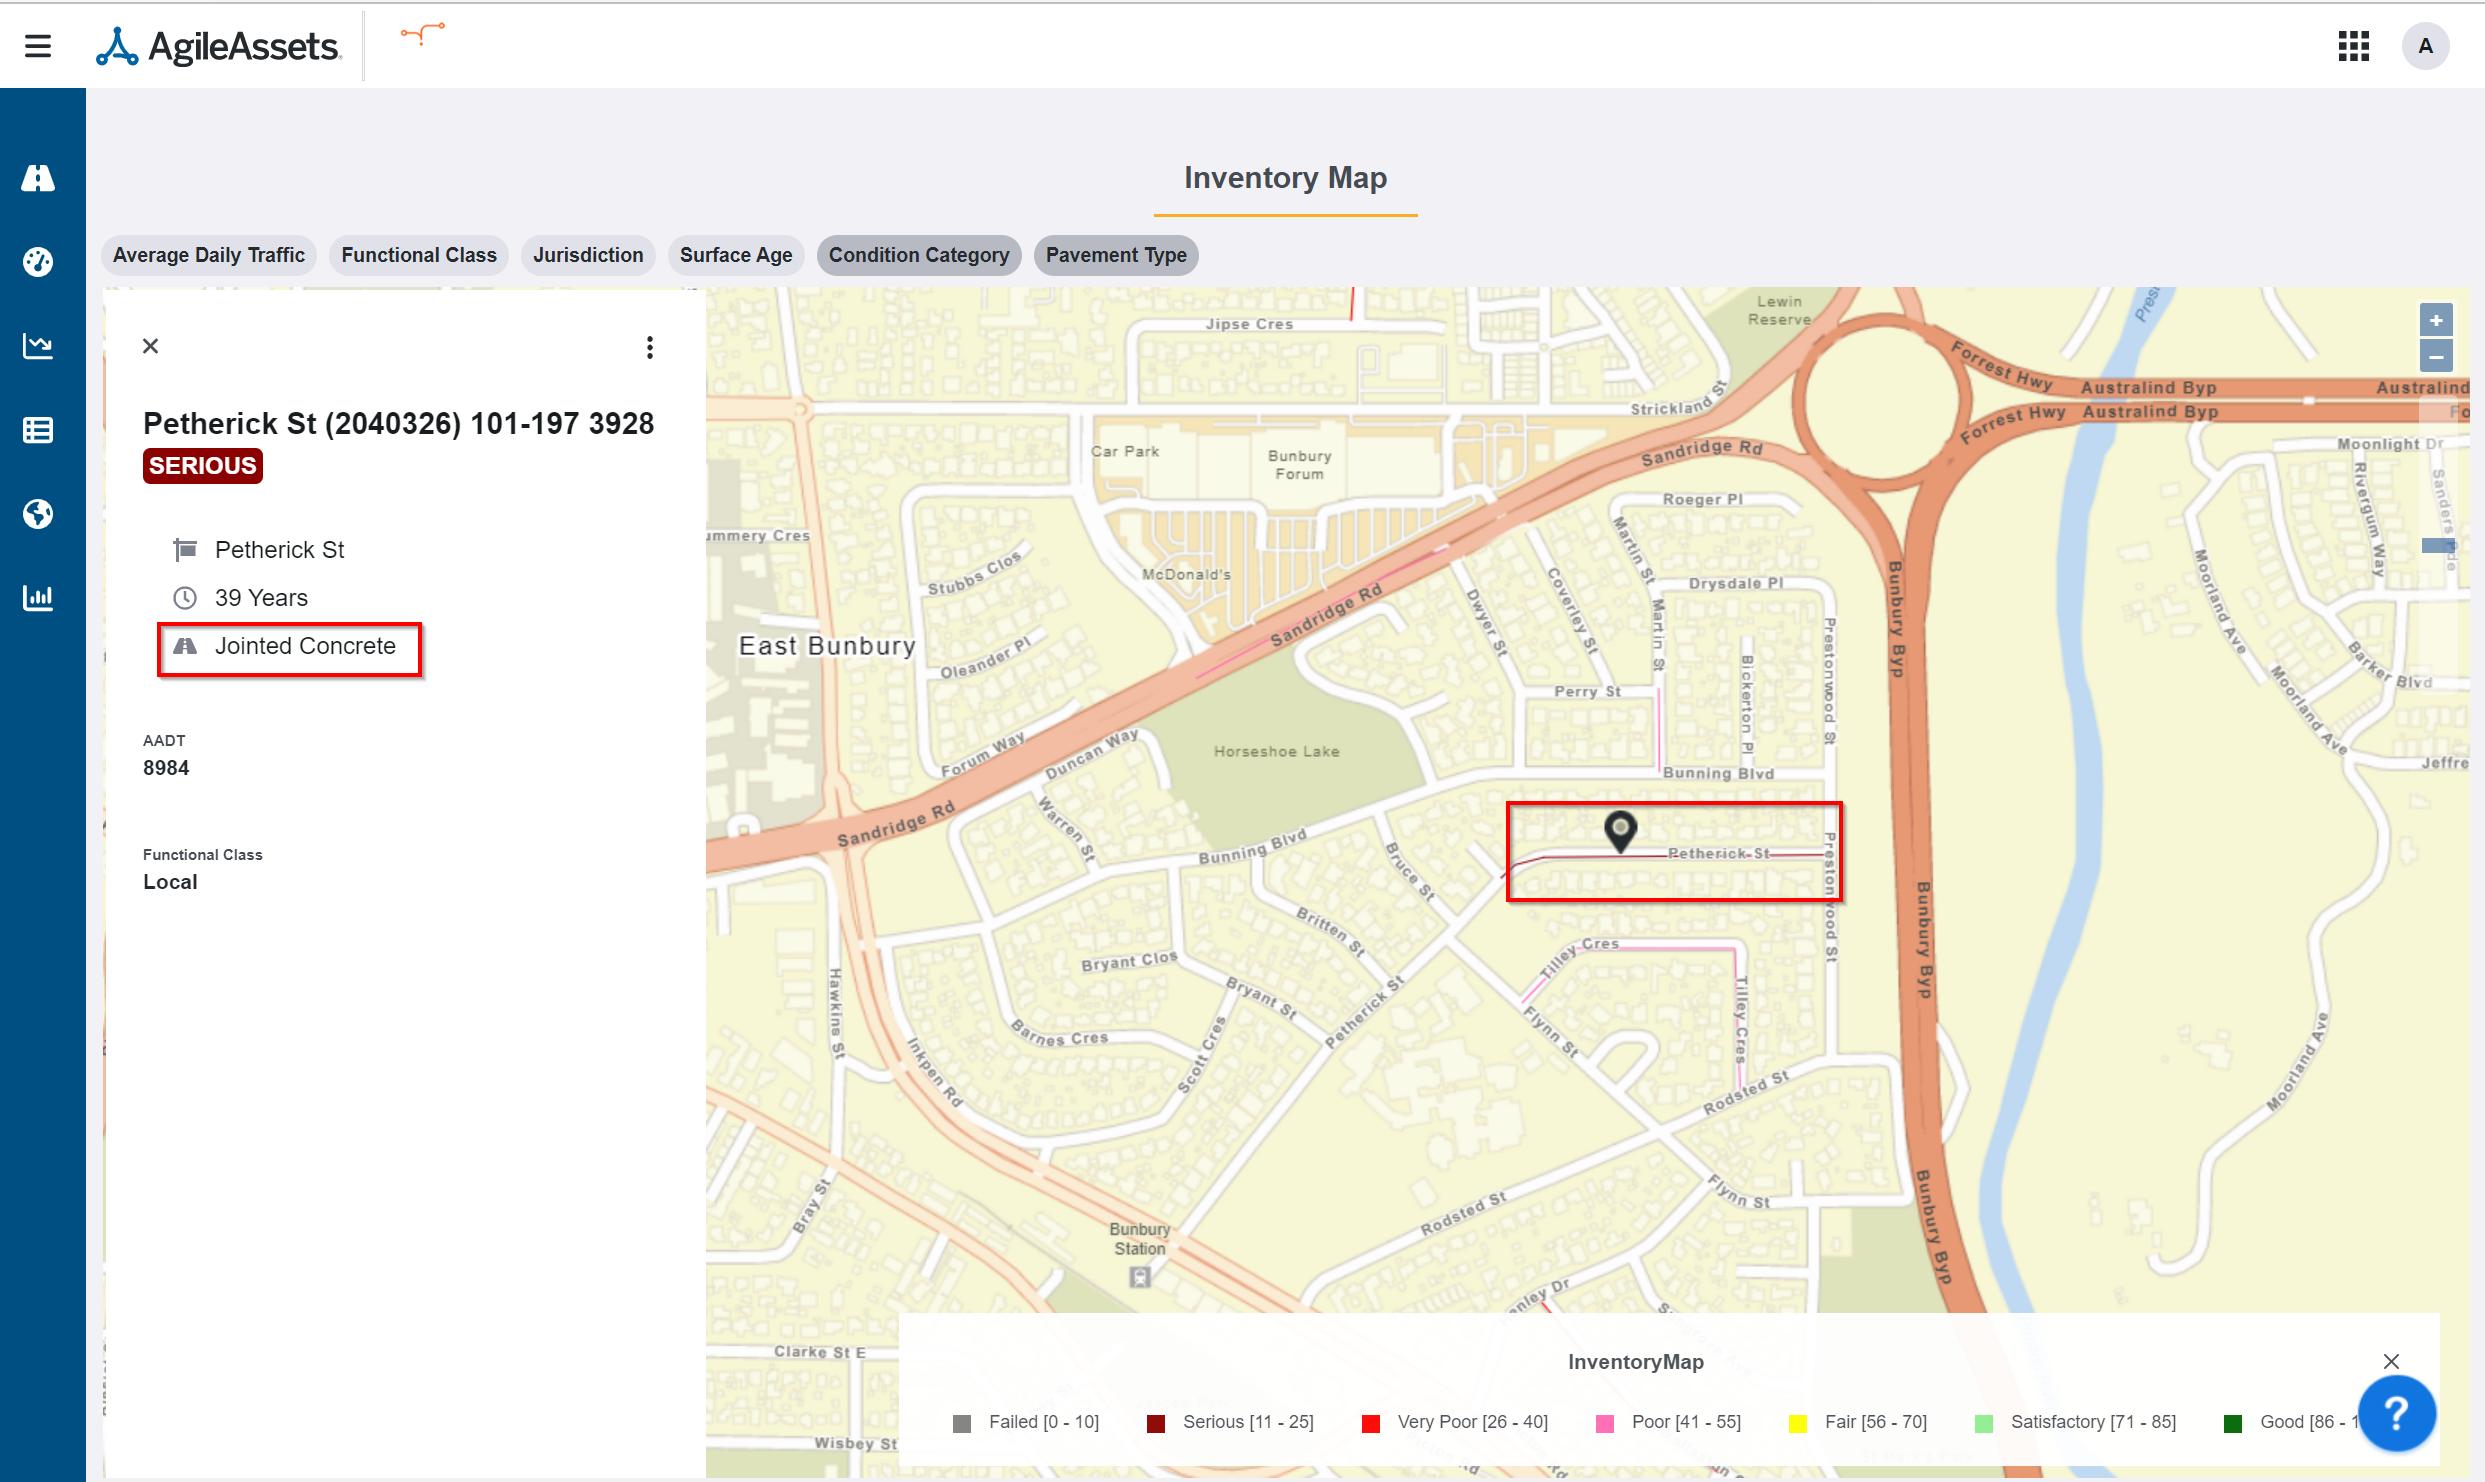
6. To see information related to a particular road on the map, click on that road segment. A side panel popup window appears with the road details.
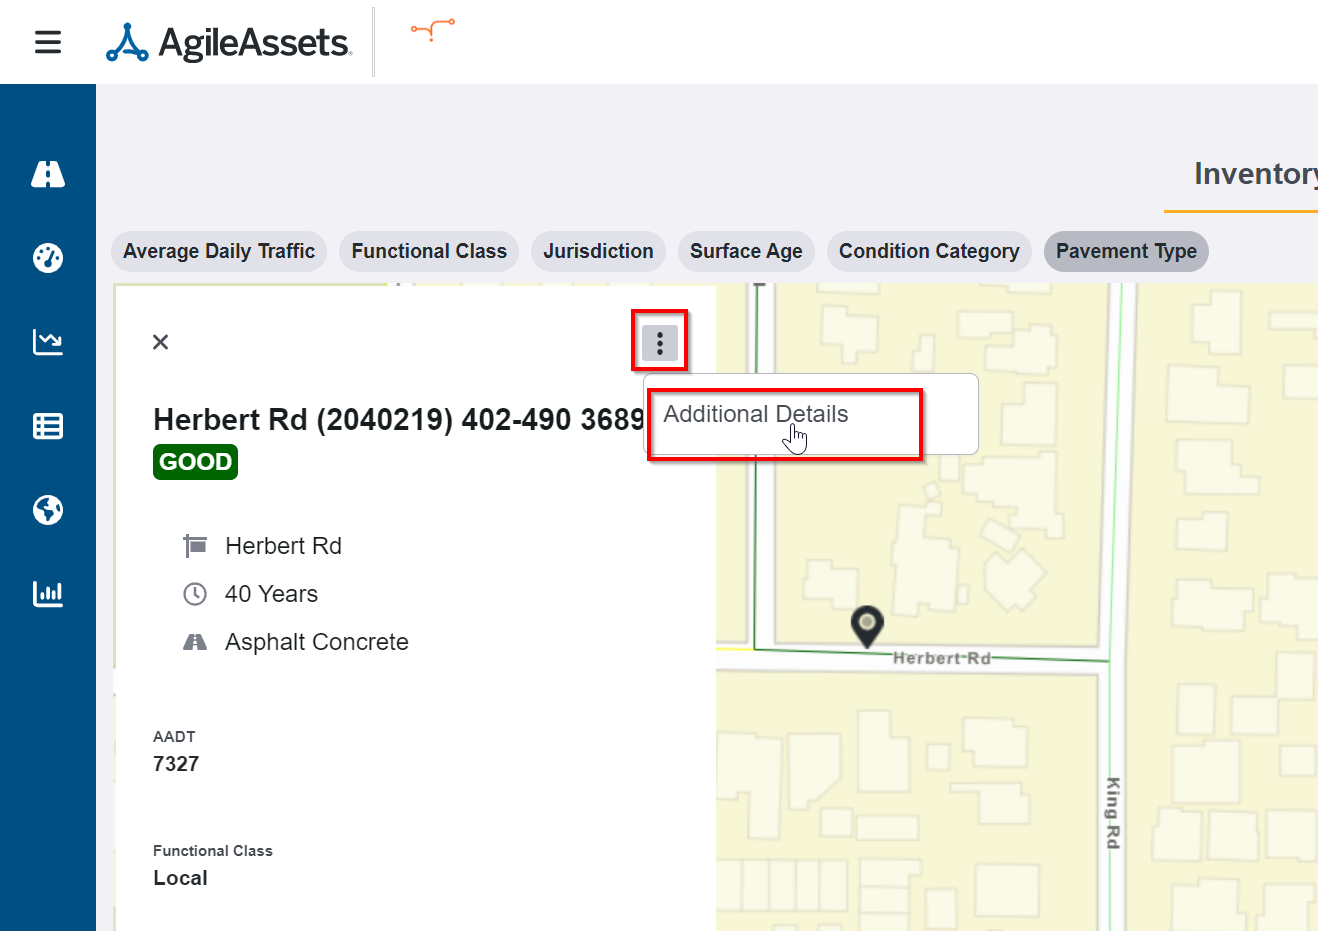
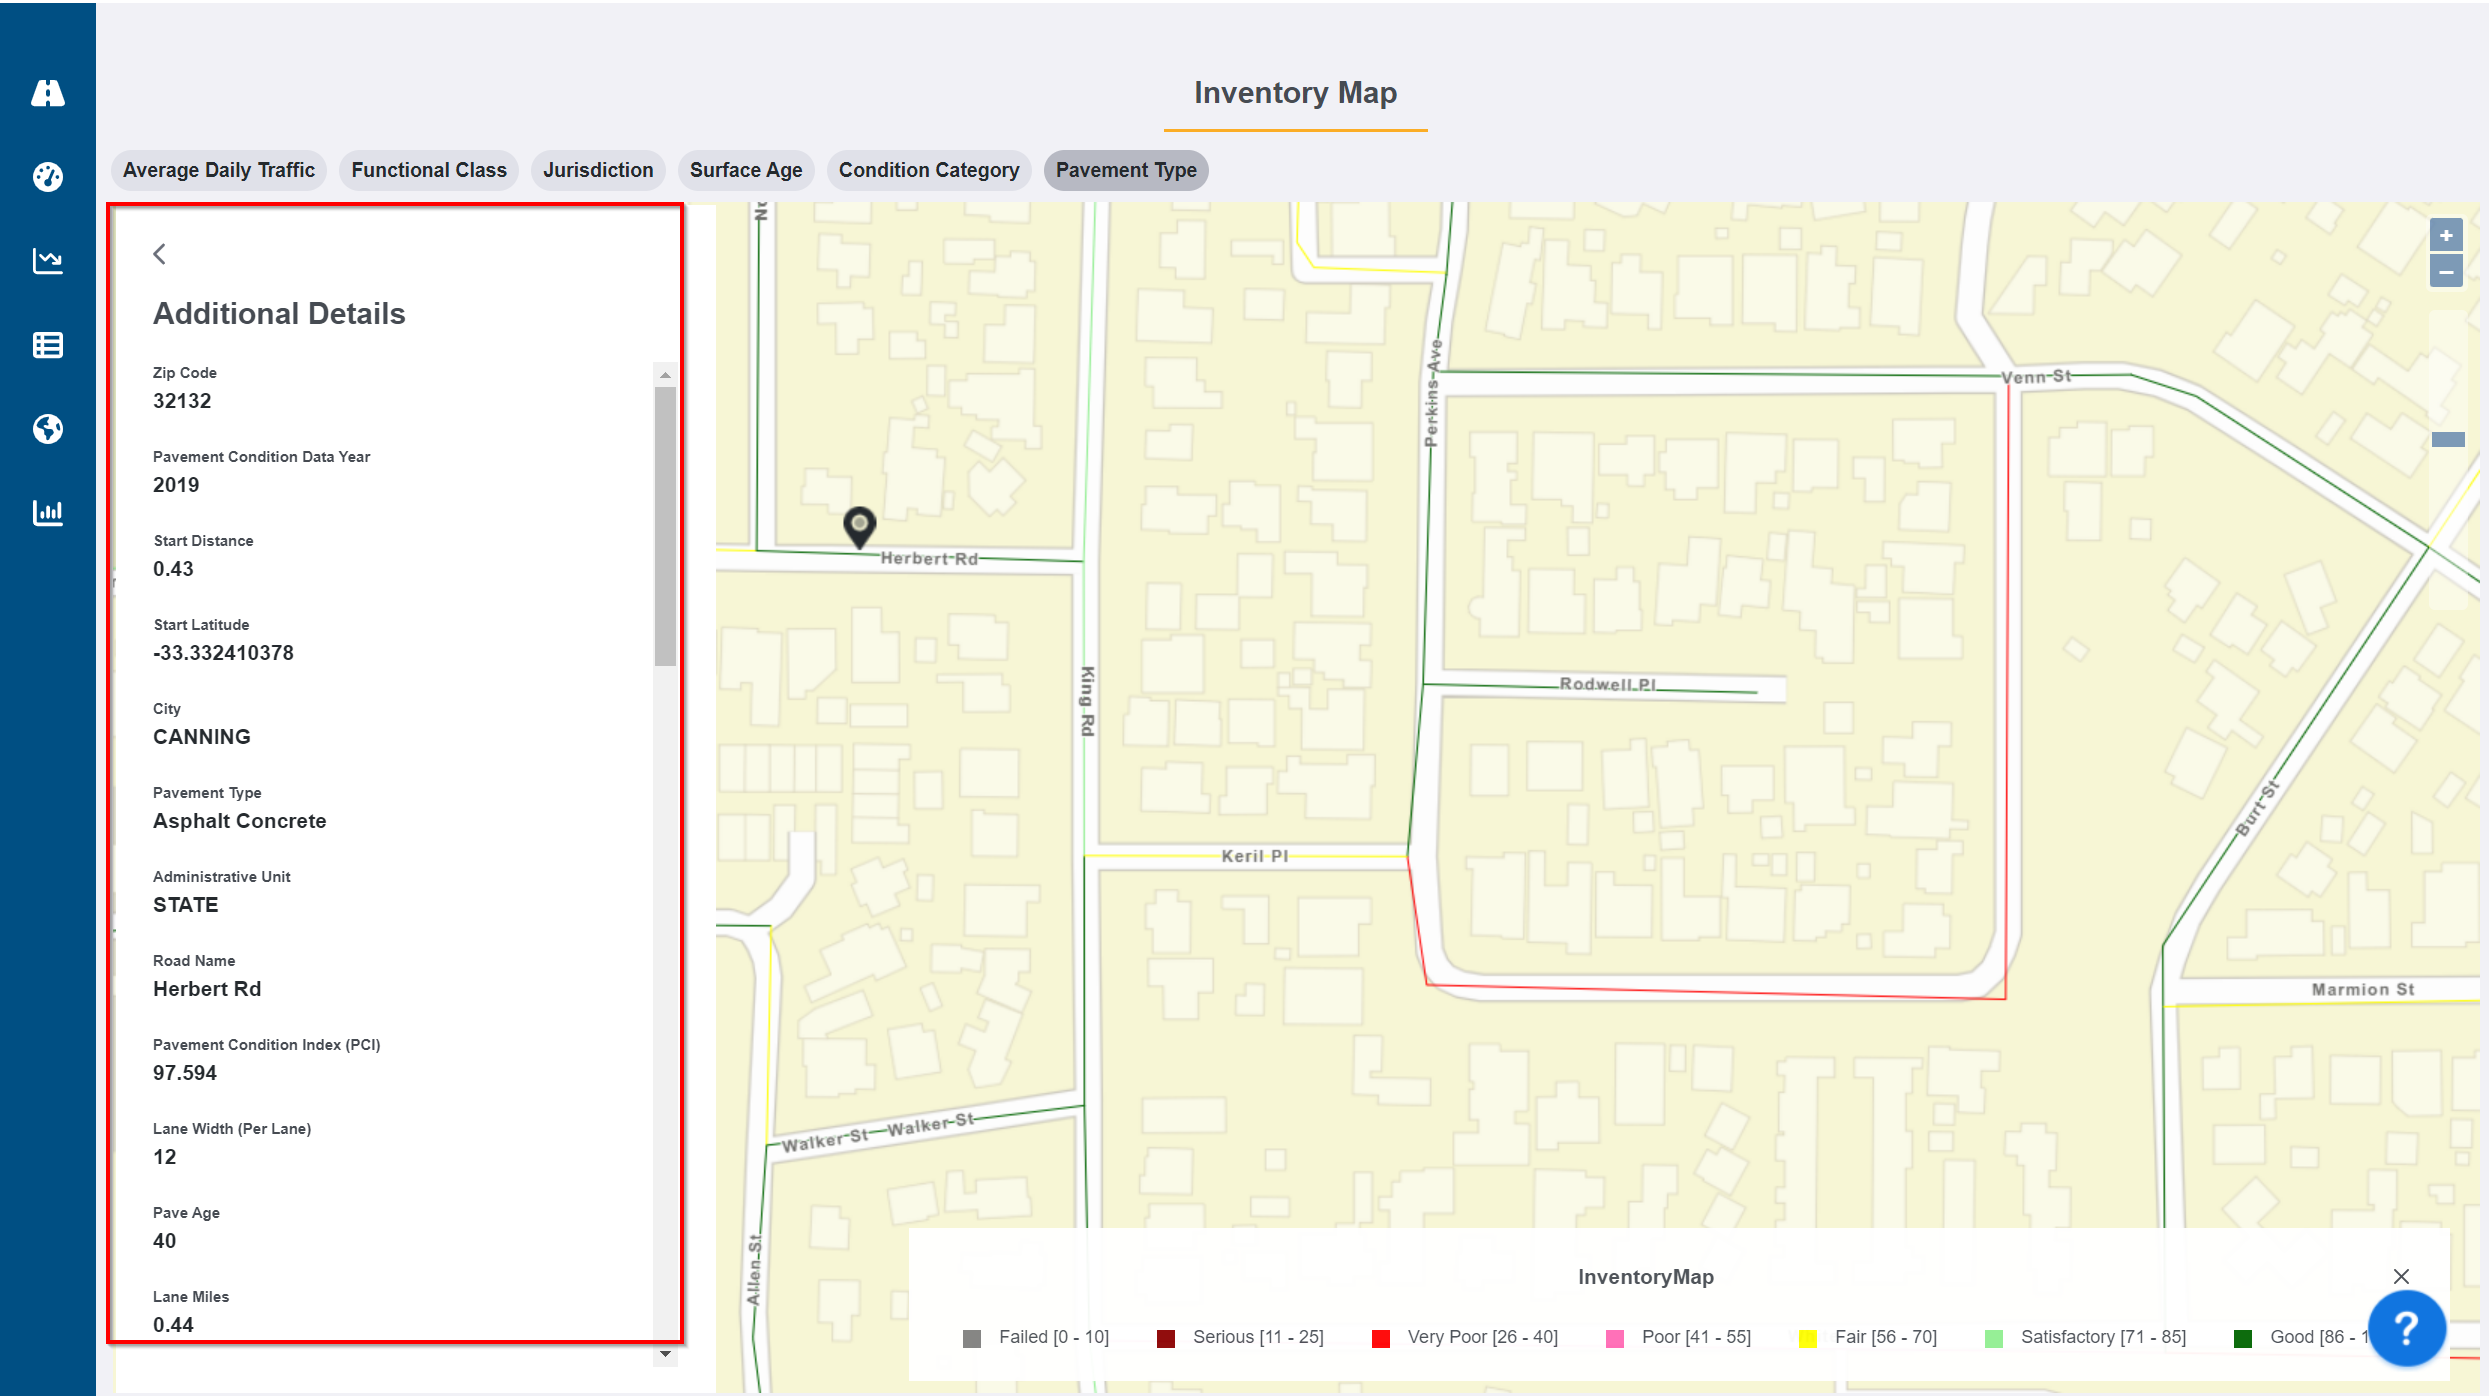
7. Next, click on the 3 Dots in the upper right-hand corner of the popup window to bring up the menu and then select Additional Details to see more attributes about the selected road segment.
Apply Map Filter to see Specific Jurisdiction Asset Information.
- From the Pavement Express default page, hover your mouse over the Asset Inventory icon (in the upper left-hand pane) to bring up the menu list and then click on ASSET INVENTORY.
- Click on the INVENTORY MAP sub-menu to open the Inventory Map window.
- Click the Plus icon
 in the upper right-hand corner of the page to zoom into the area of interest.
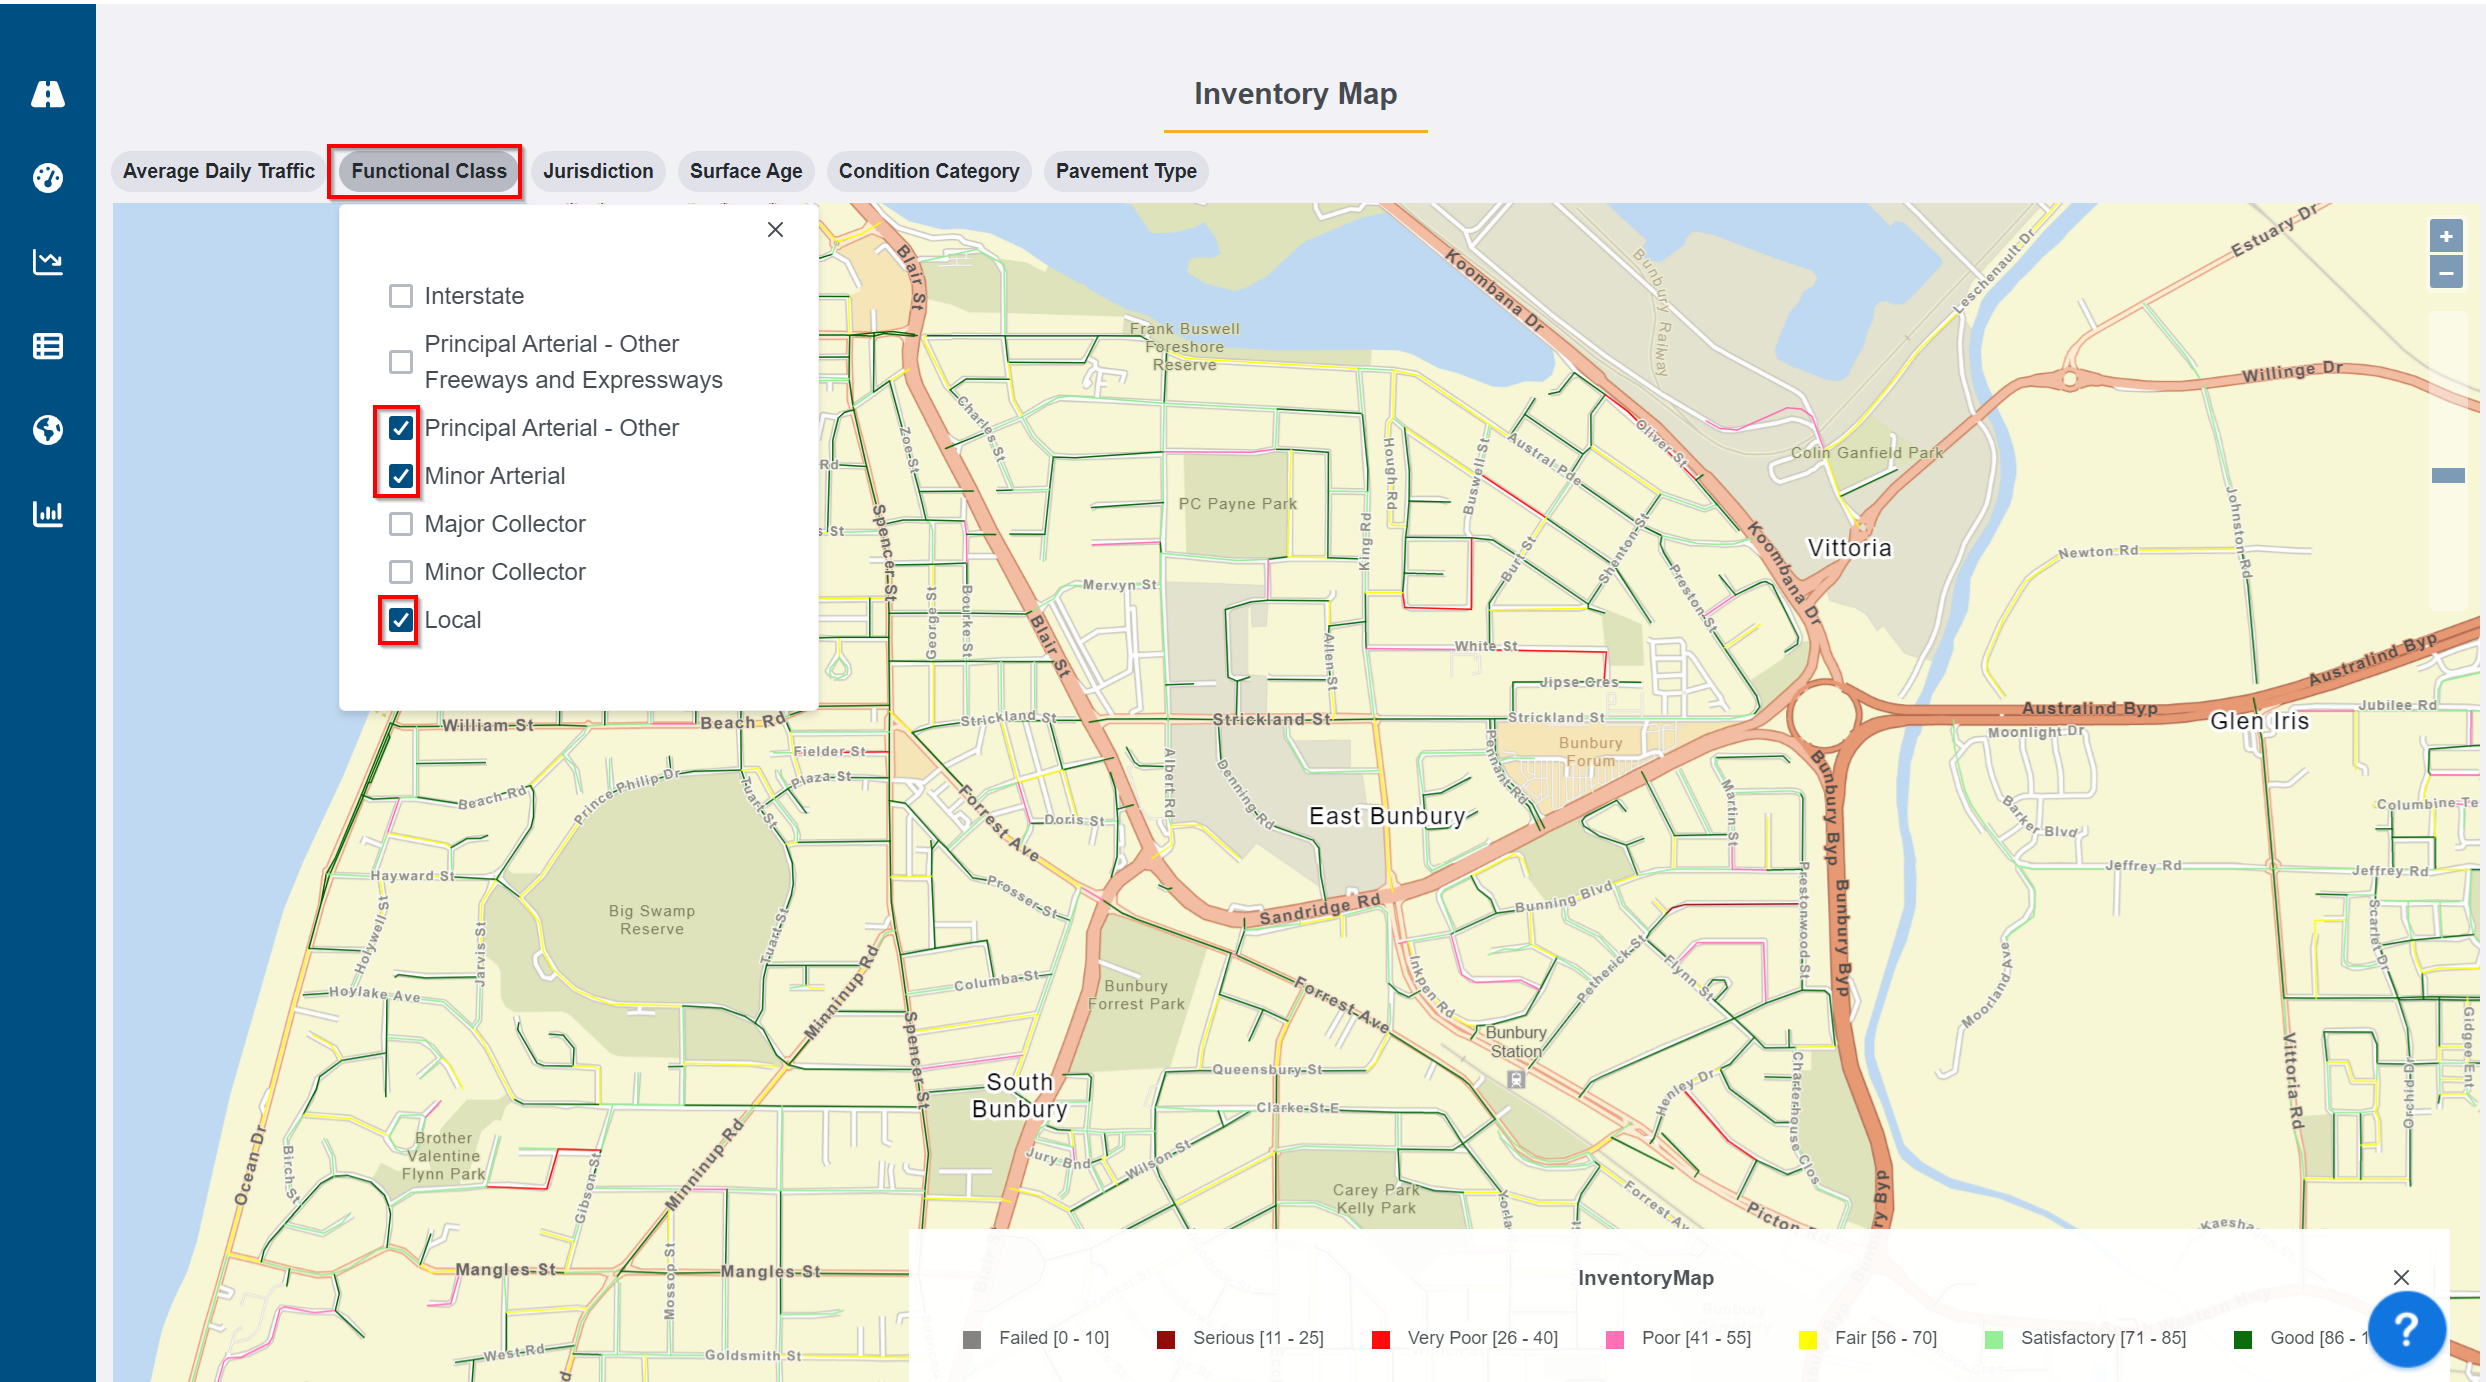
 - Click on the Functional Class filter bubble and select the option(s) of interest by clicking the checkboxes adjacent to the functional class name. You can also de-select functional class by unchecking the checkboxes adjacent to the class name.
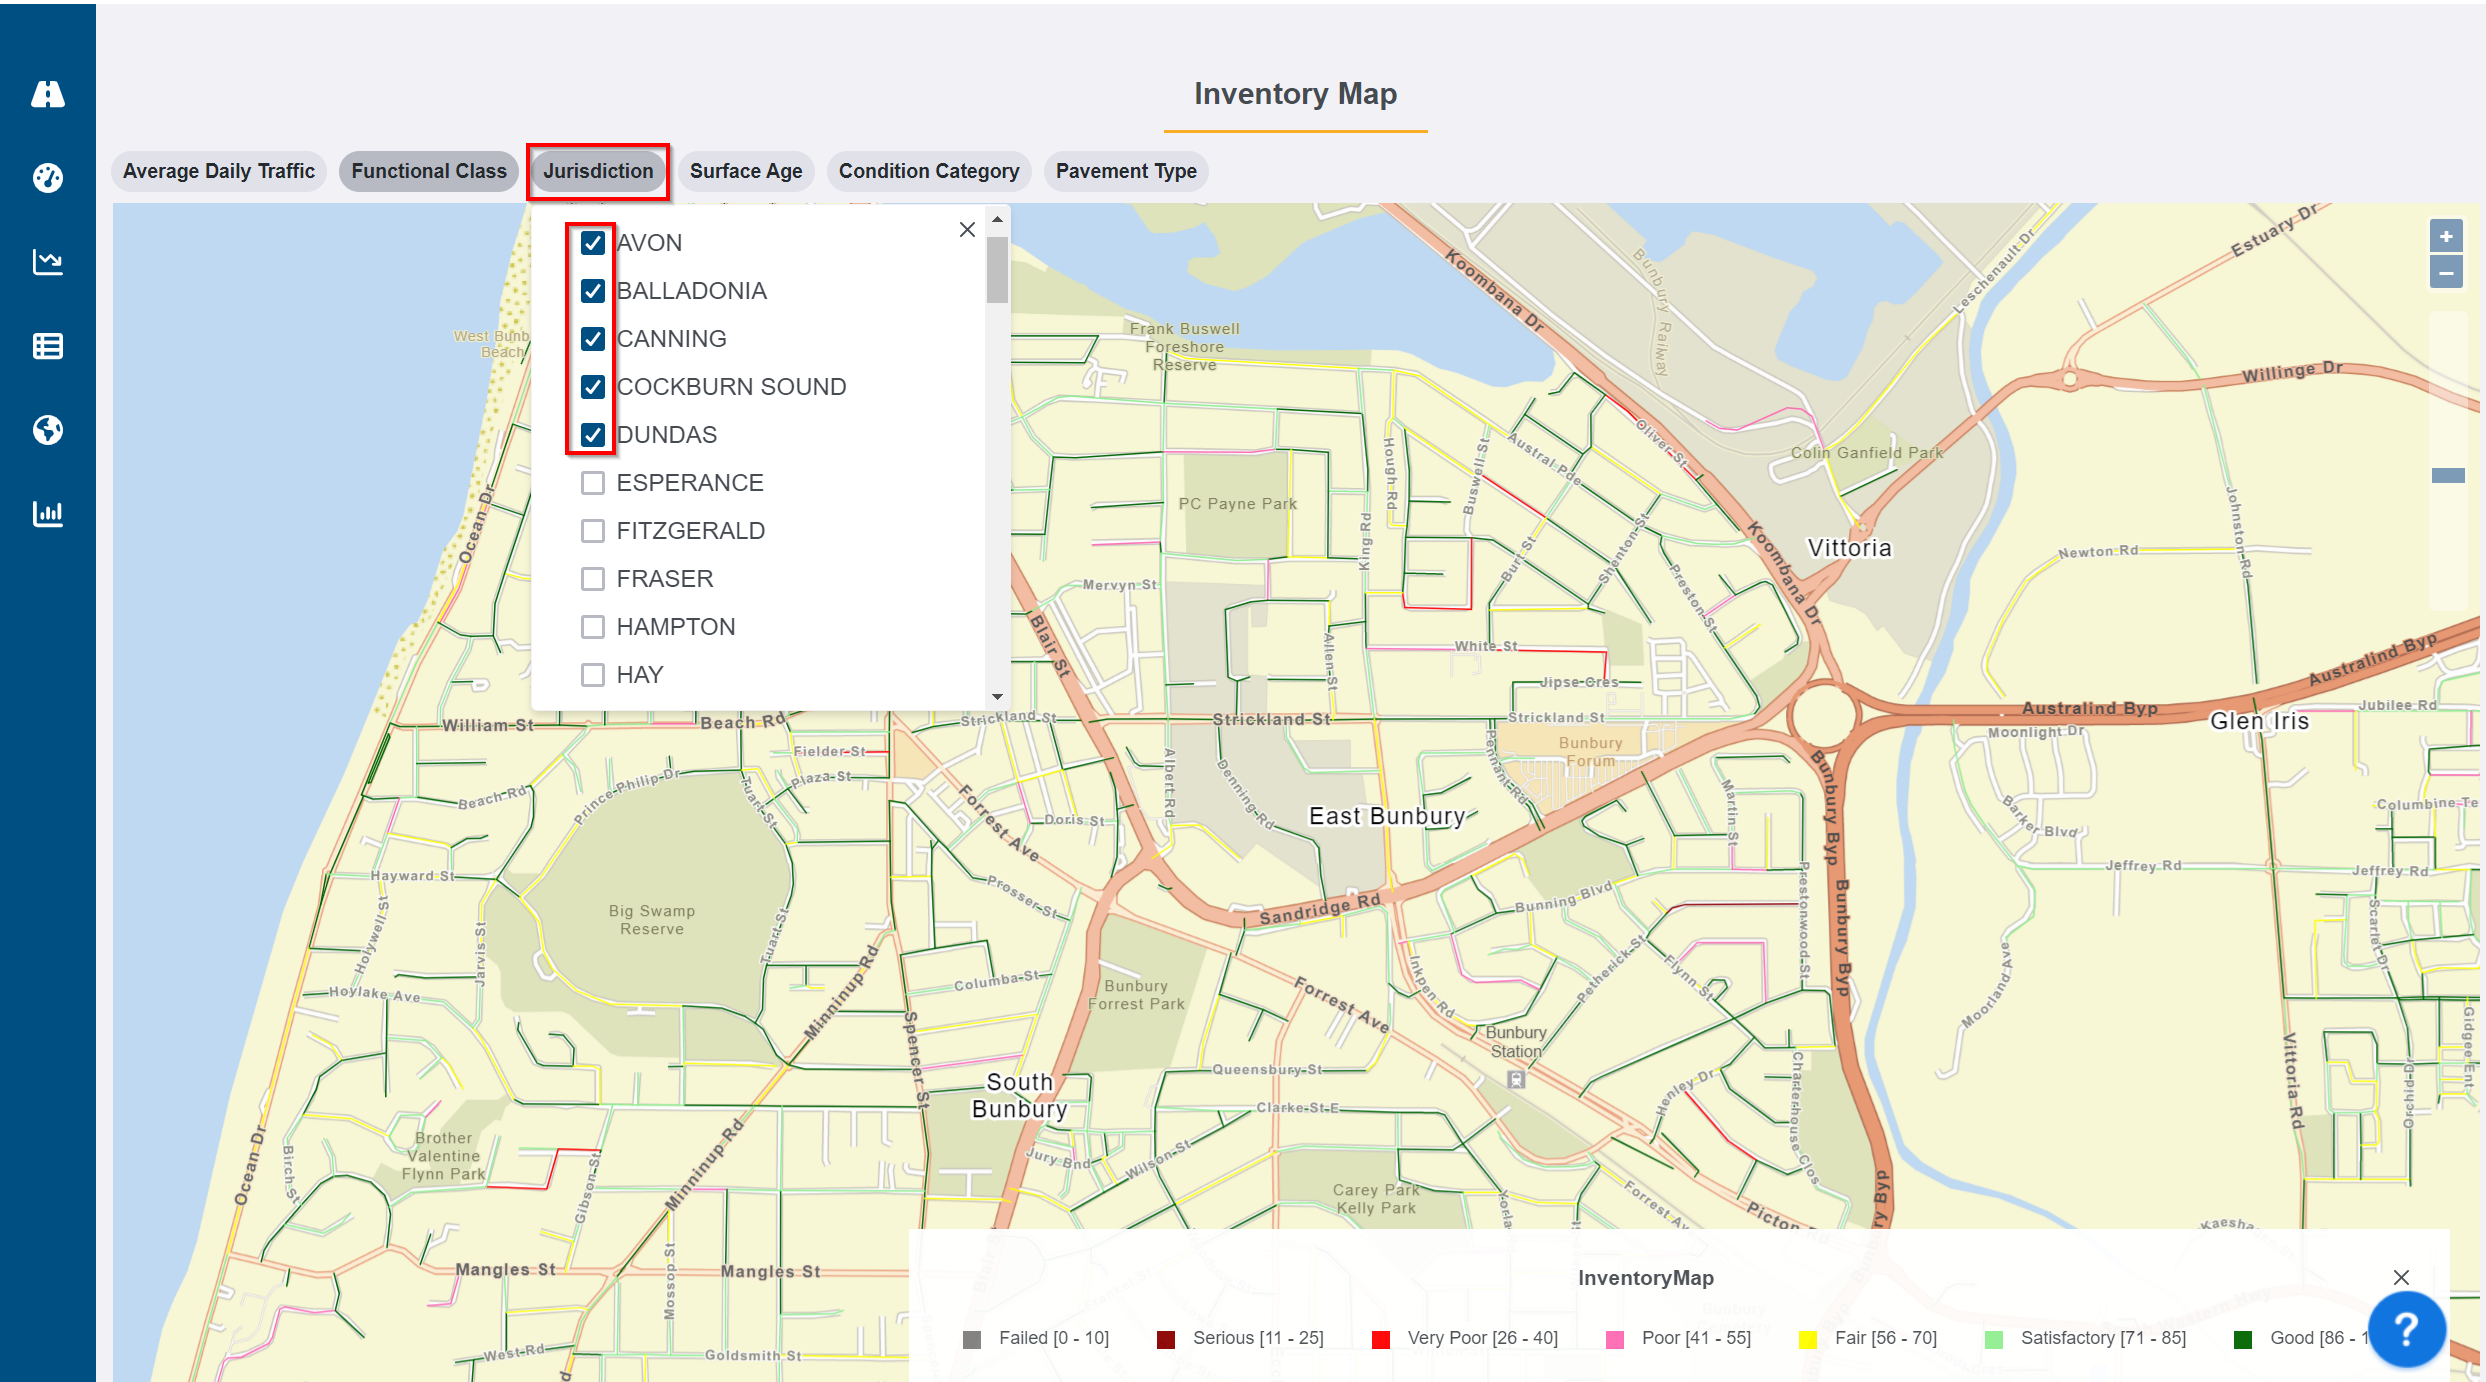
- Click on the Jurisdiction filter bubble and select the option(s) of interest by clicking the checkboxes adjacent to the jurisdiction name. You can also de-select jurisdiction by unchecking the checkboxes adjacent to the jurisdiction name.
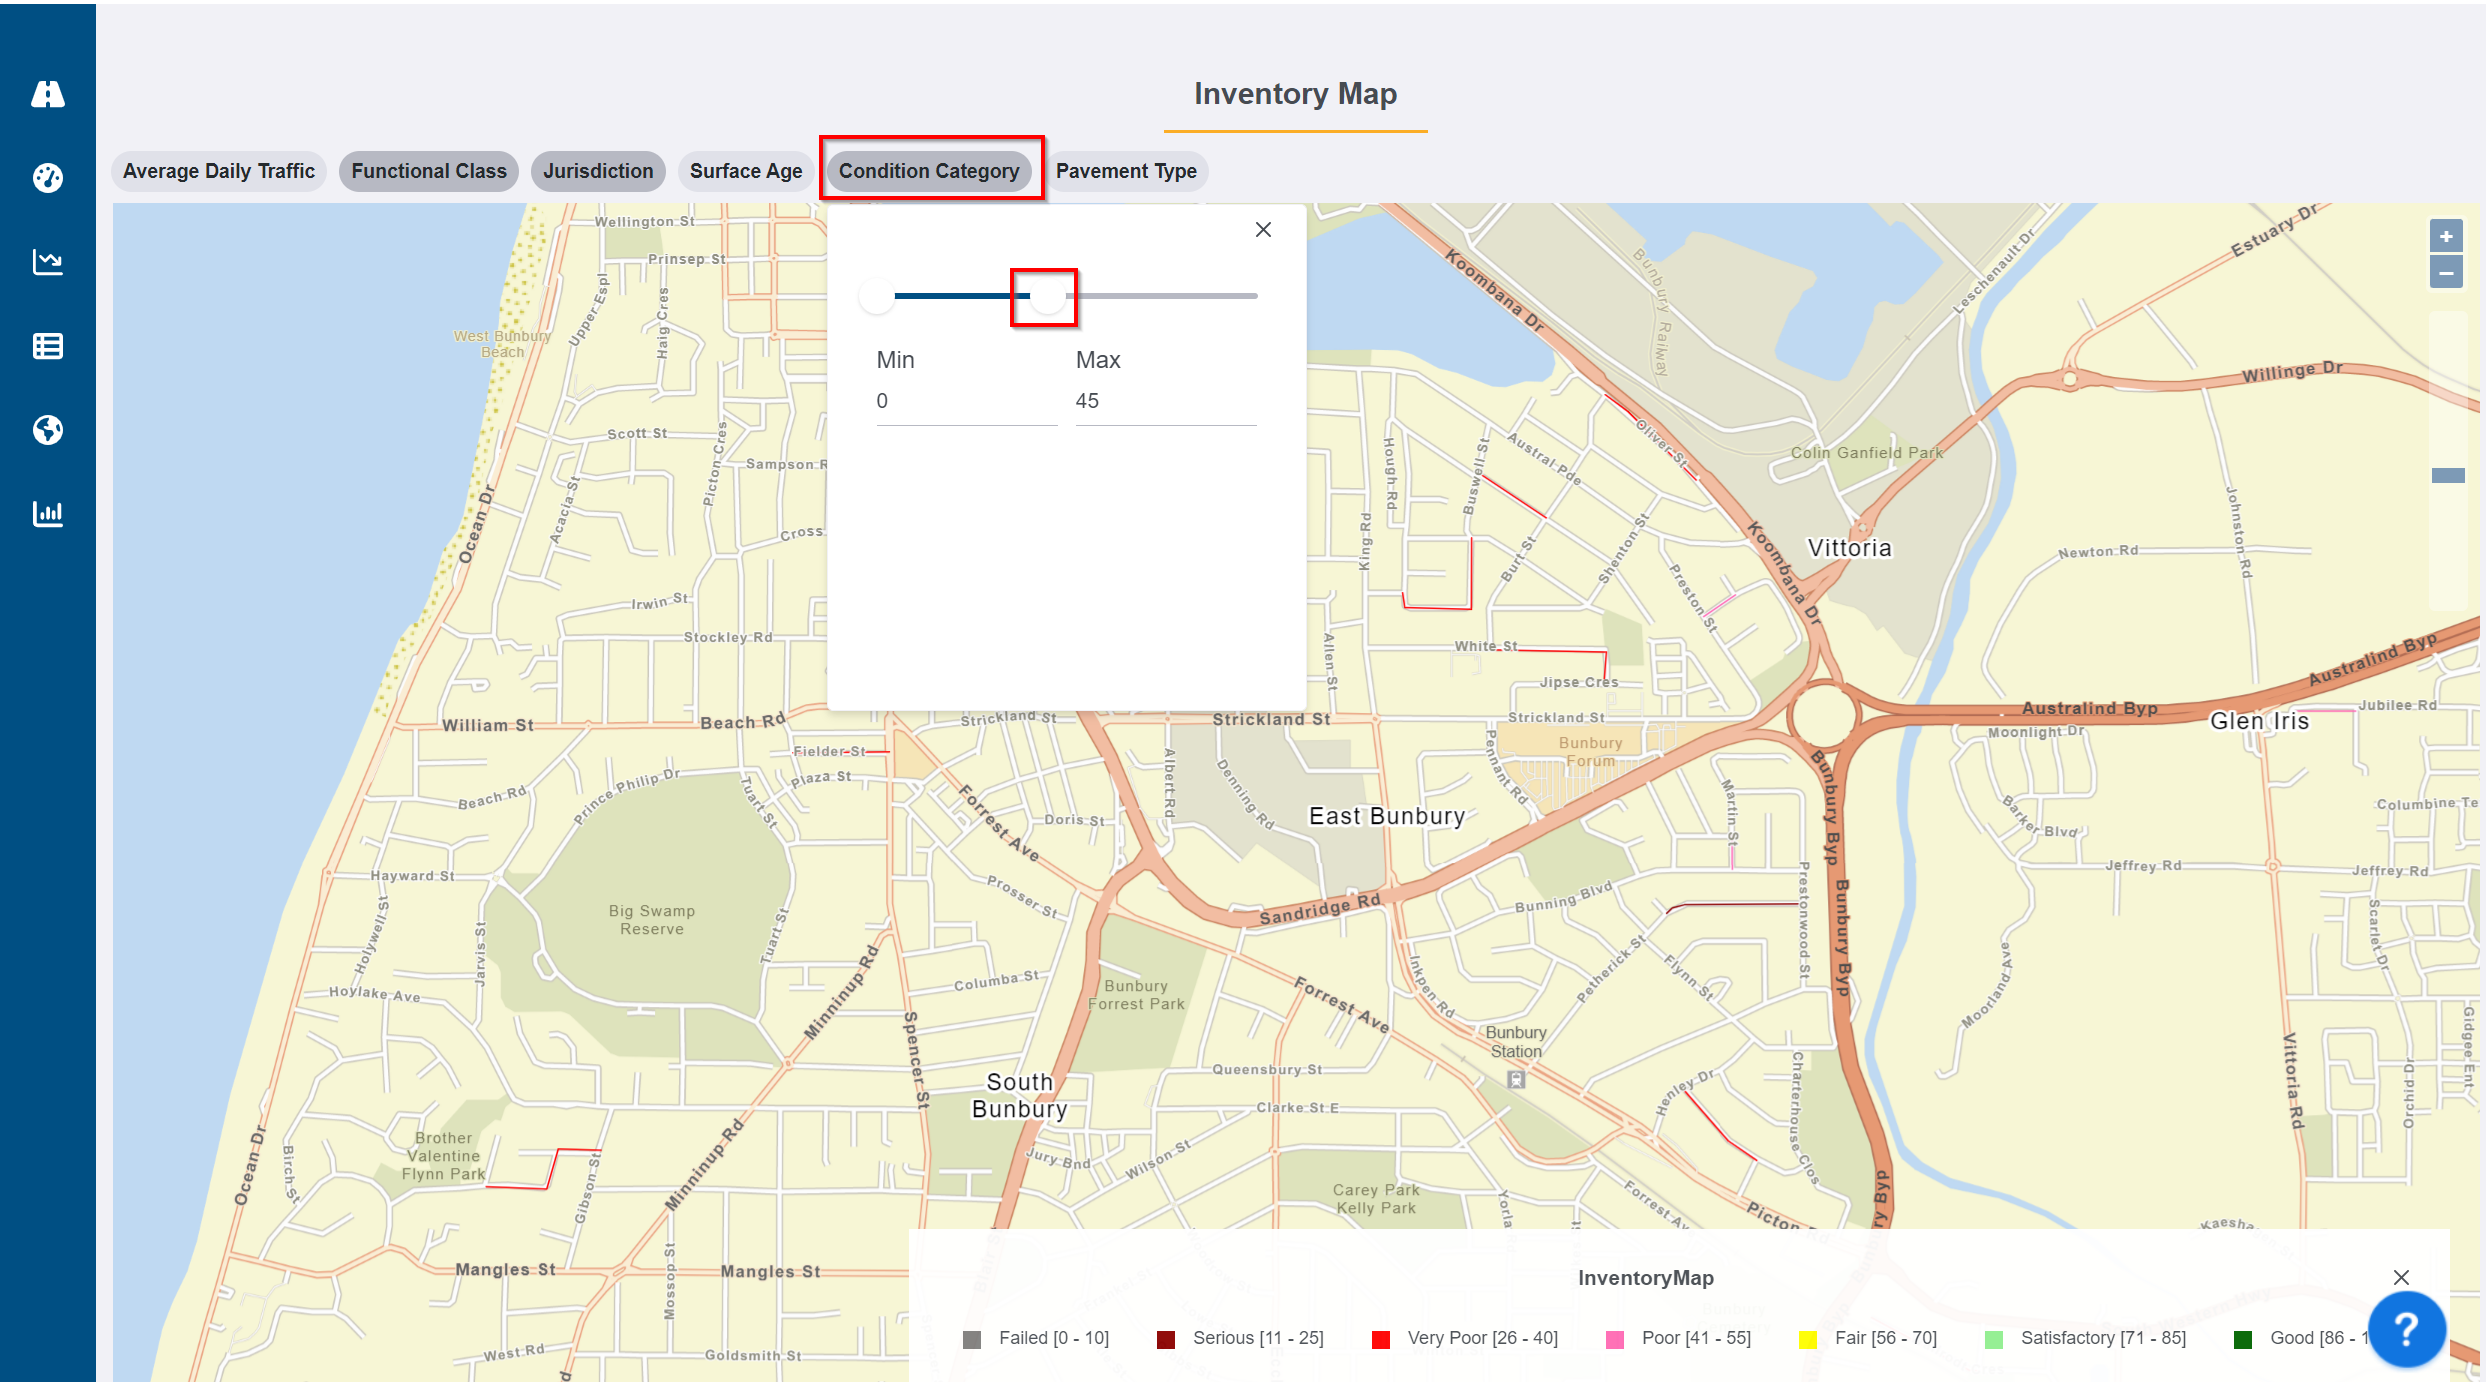
6. Click on the Condition Category filter bubble and adjust the (Min/Max) values by either manually typing in the values or using the slider to adjust the values to see roads condition within your network that are Good, Bad, and Worse.
7. Based on the graphical results on the map, click on any road to see the details.
Understanding Network Performance
- From the Pavement Express default page, hover your mouse over the Asset Inventory icon (in the upper left-hand pane) to bring up the menu list and then click on ASSET INVENTORY.
- Click on the INVENTORY MAP sub-menu to open the Inventory Map window.
- Click the Plus icon in the upper right-hand corner of the page to zoom into the area of interest.
- Click on the Condition Category filter bubble and adjust the (Min/Max) values by either manually typing in the values or using the slider to adjust the values to see roads condition within your network that are Good, Bad, and Worse.
- Click on the Pavement Type filter bubble and select Asphalt Concrete and Jointed Concrete. when finished, click anywhere on the map to apply the filter
6. Based on the results, click on any road segment to see the details.
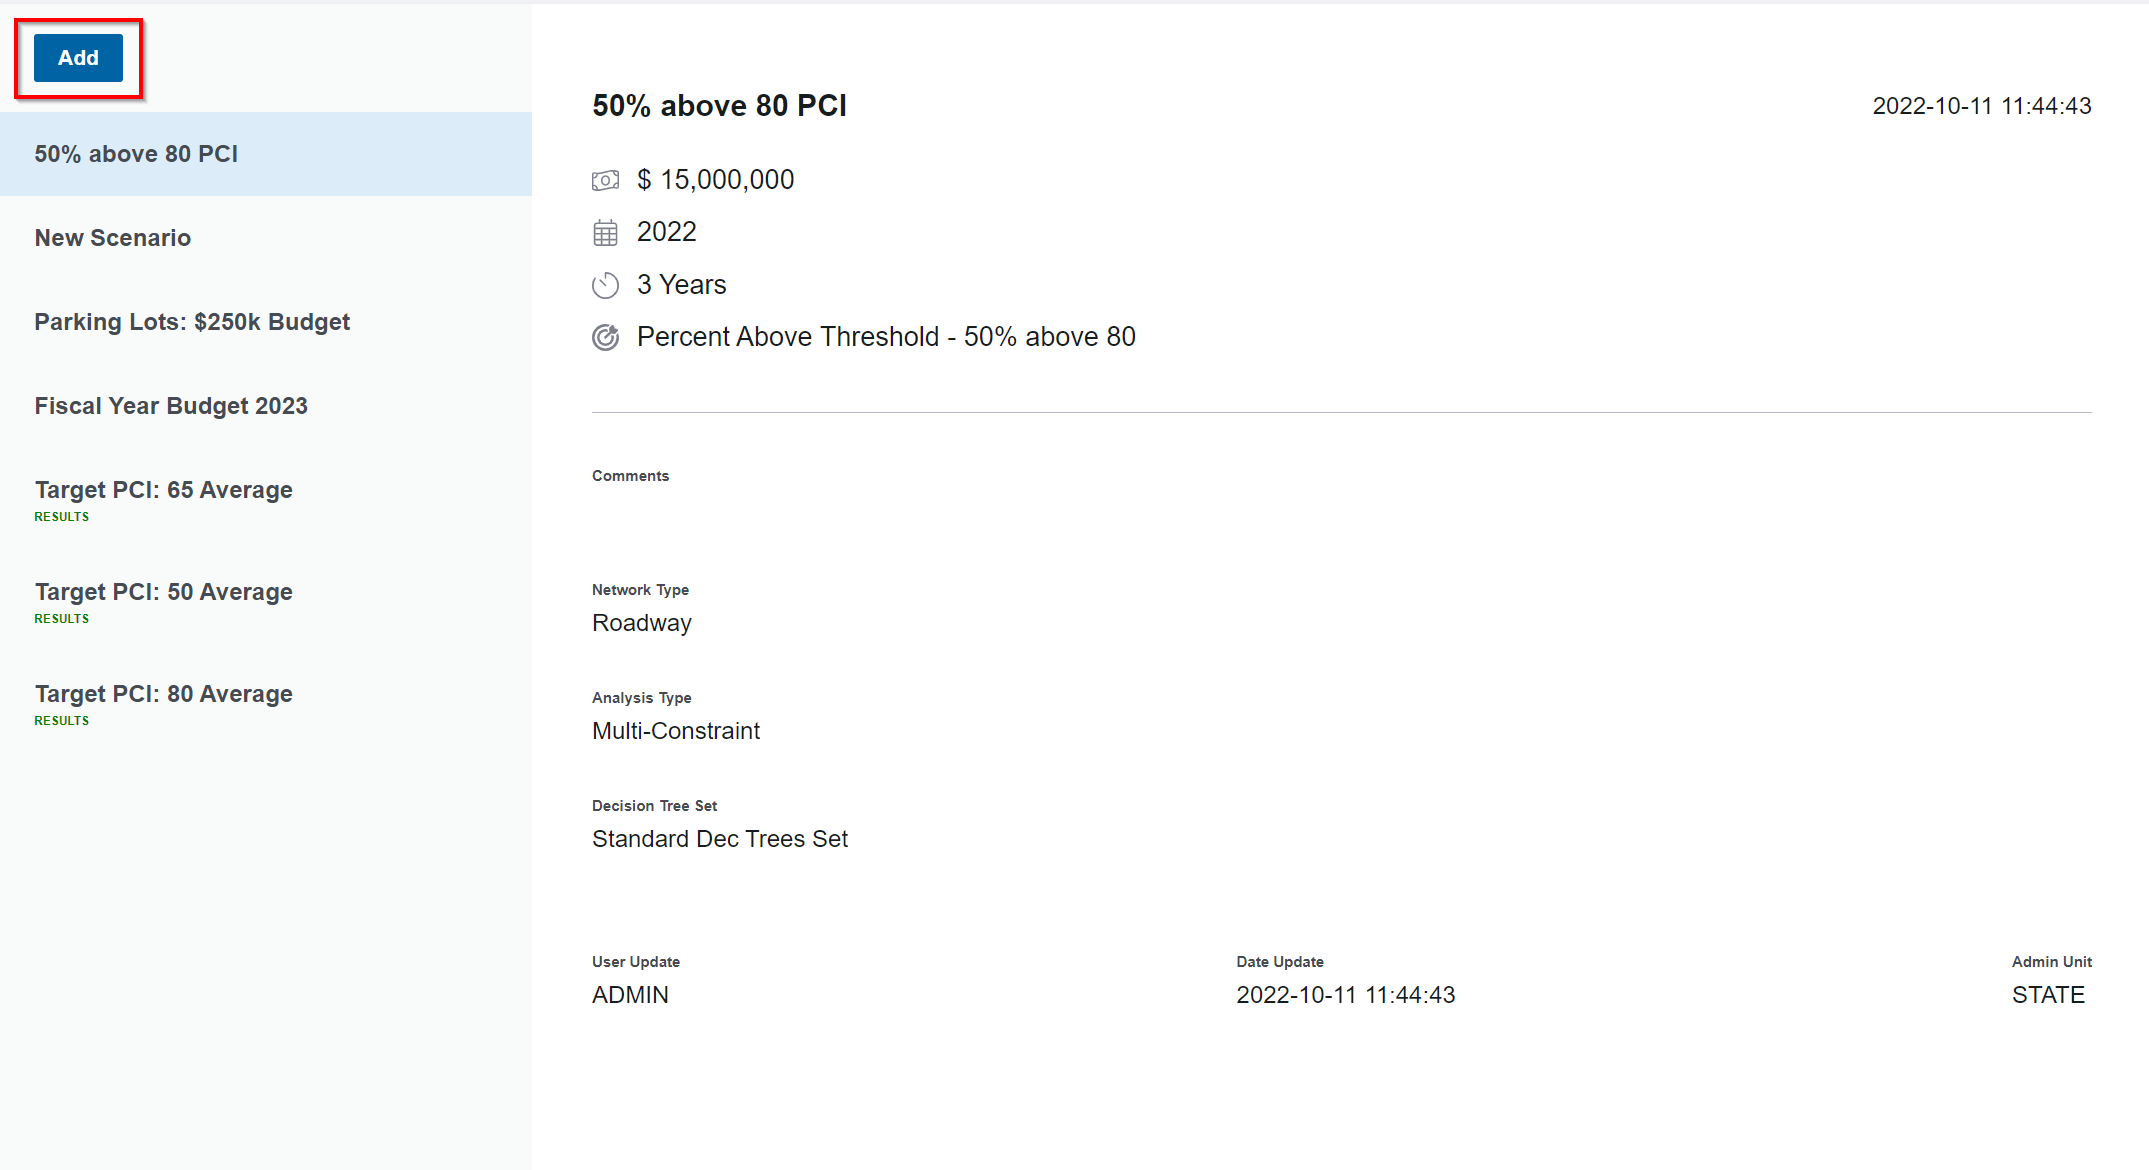
Create Scenarios Work Plan
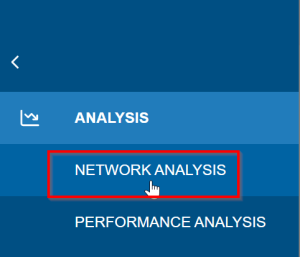
1. From the Pavement Express default page, hover your mouse over the ANALYSIS icon (in the upper left-hand pane) to bring up the menu list and then click on NETWORK ANALYSIS.
2. Click on NETWORK ANALYSIS to open its sub menus.
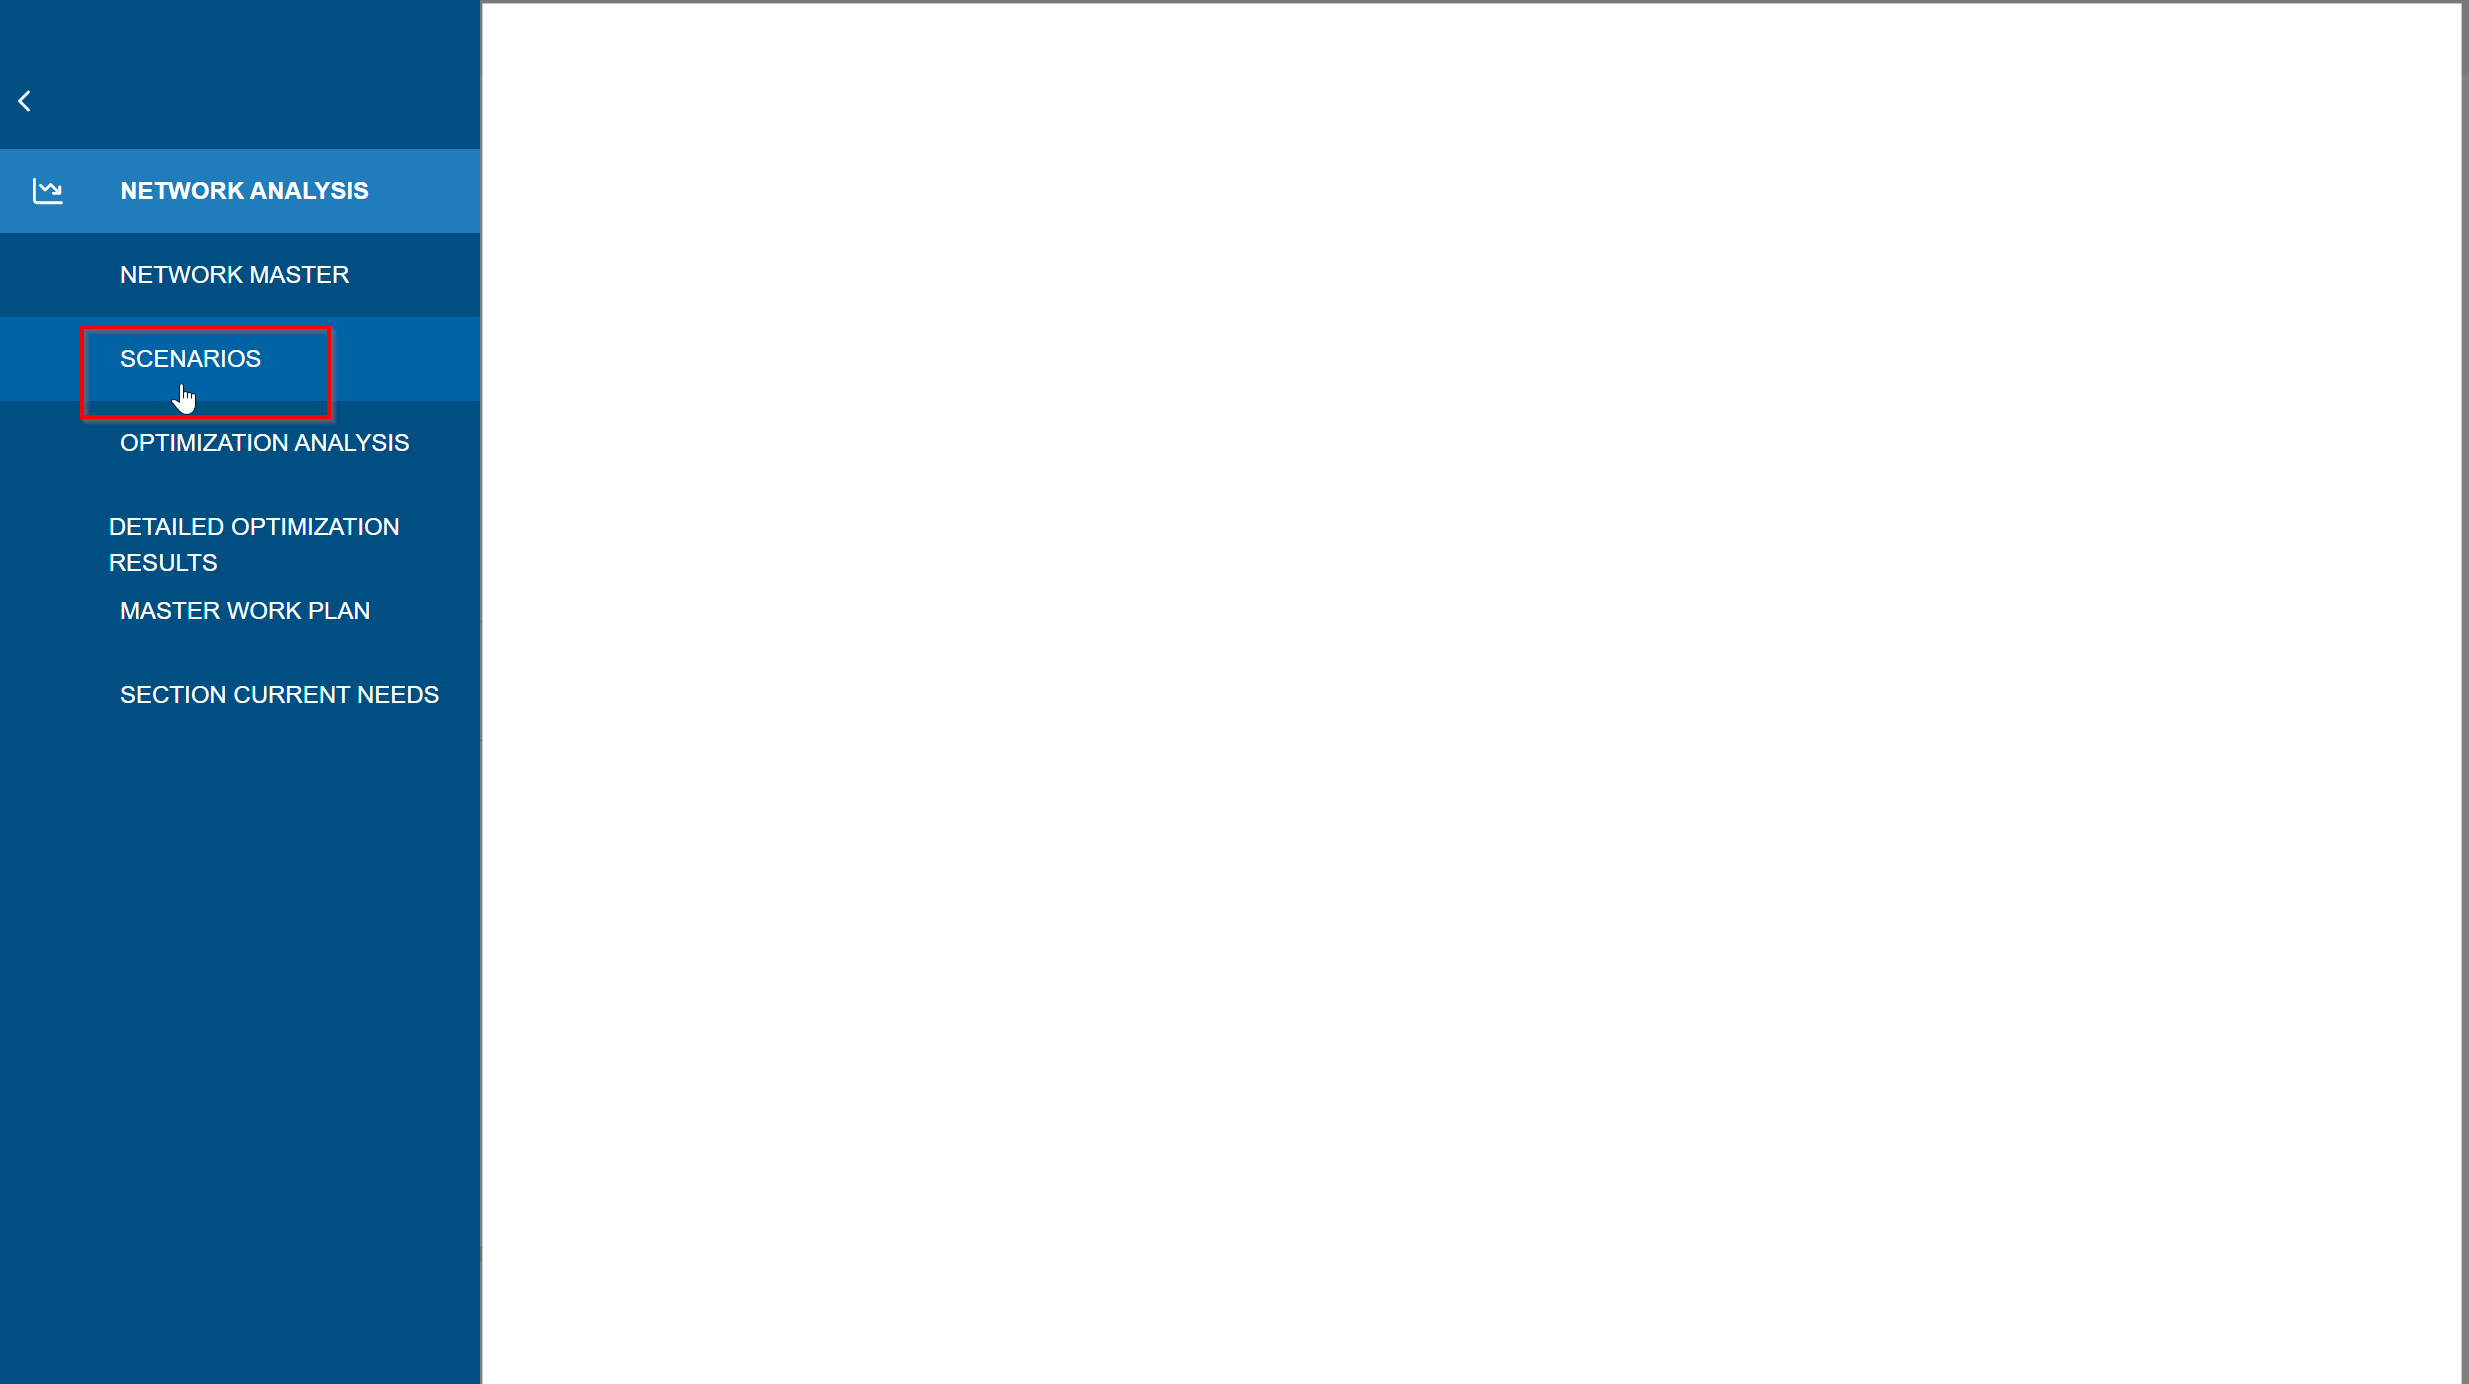
3. Click on SCENARIOS to open the Scenarios window.

4. Click the Add button to create a new scenario.
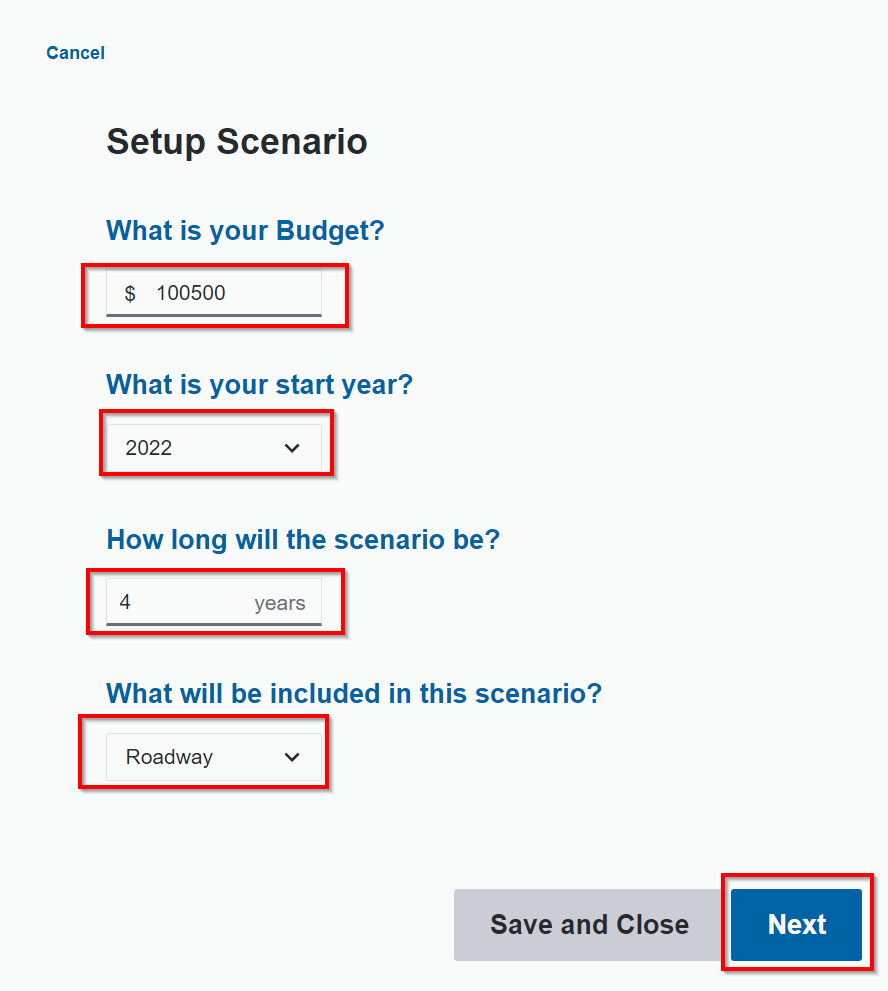
5. In the Budget field, input the dollar amount.
6. Click the year dropdown and select a Start Year for your scenario.
7. Enter a numeric value of how many years the scenario will be setup for.
8. Click the dropdown of what is to be included in the scenario and choose an option.
9. Click the Next button when finished.
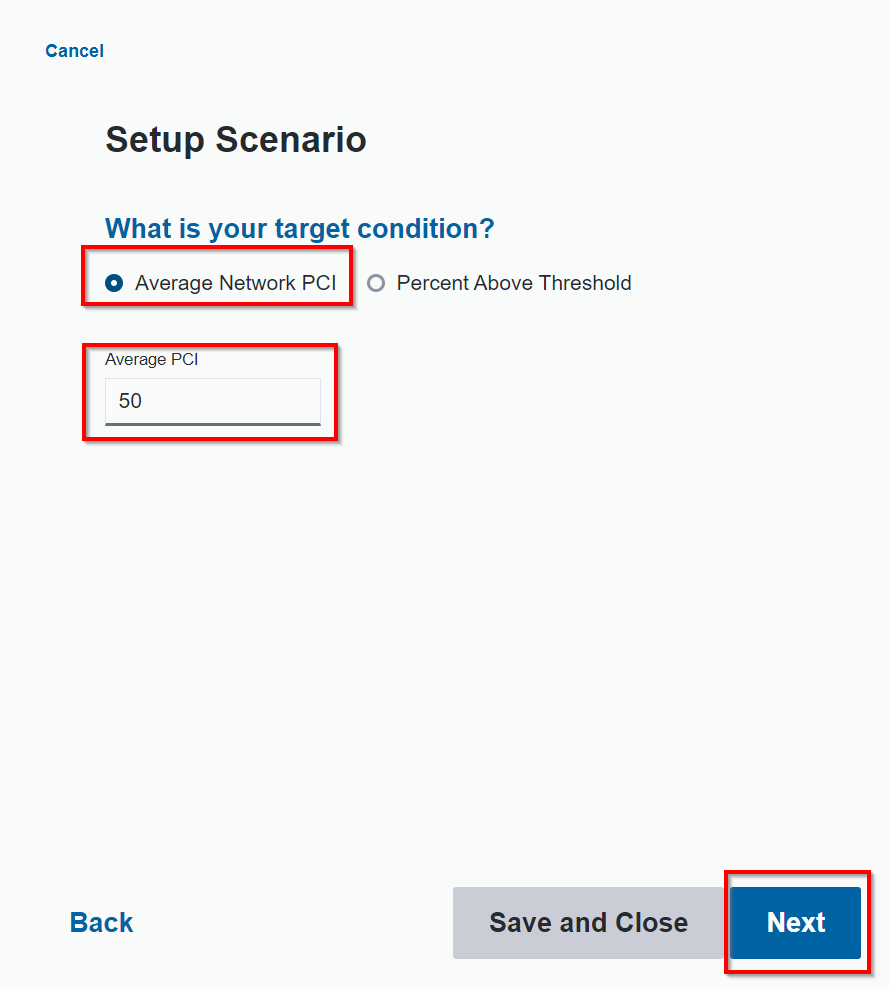
10. Select a target condition (Average Network PCI or Percent Above Threshold) and input a numeric value in the Average PCI field.
11. Click the Next button when finished.
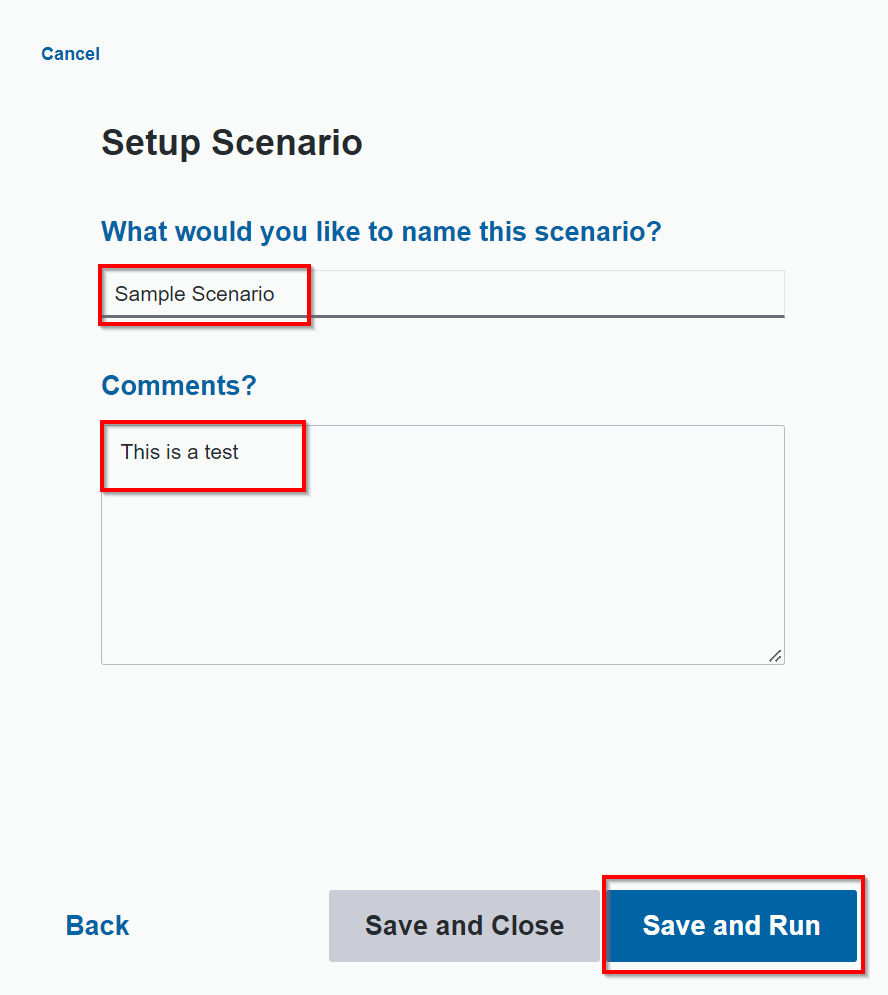
12. Give the scenario a name and add your comments if applicable.
13. Click the Save and Run button to process the Scenario.
Anchor Viewing and Understanding Scenario Results Viewing and Understanding Scenario Results
Viewing and Understanding Scenario Results
| Viewing and Understanding Scenario Results | |
| Viewing and Understanding Scenario Results |
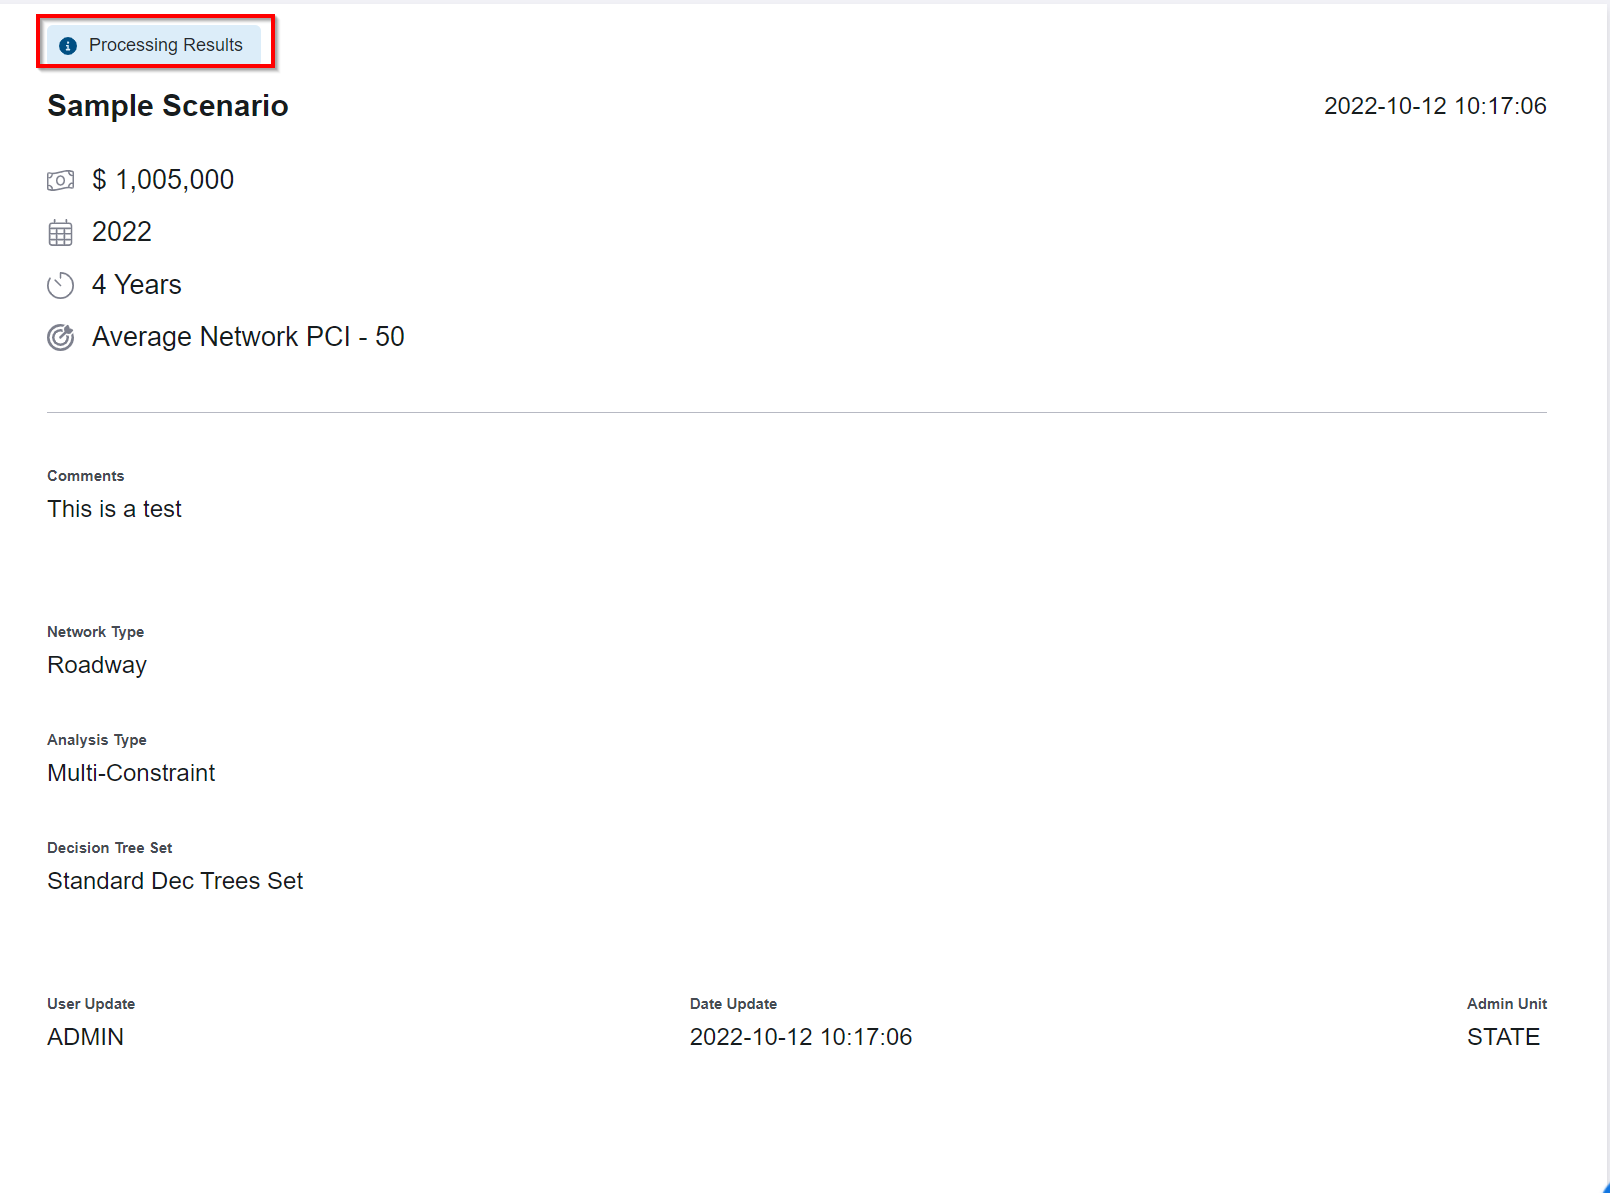
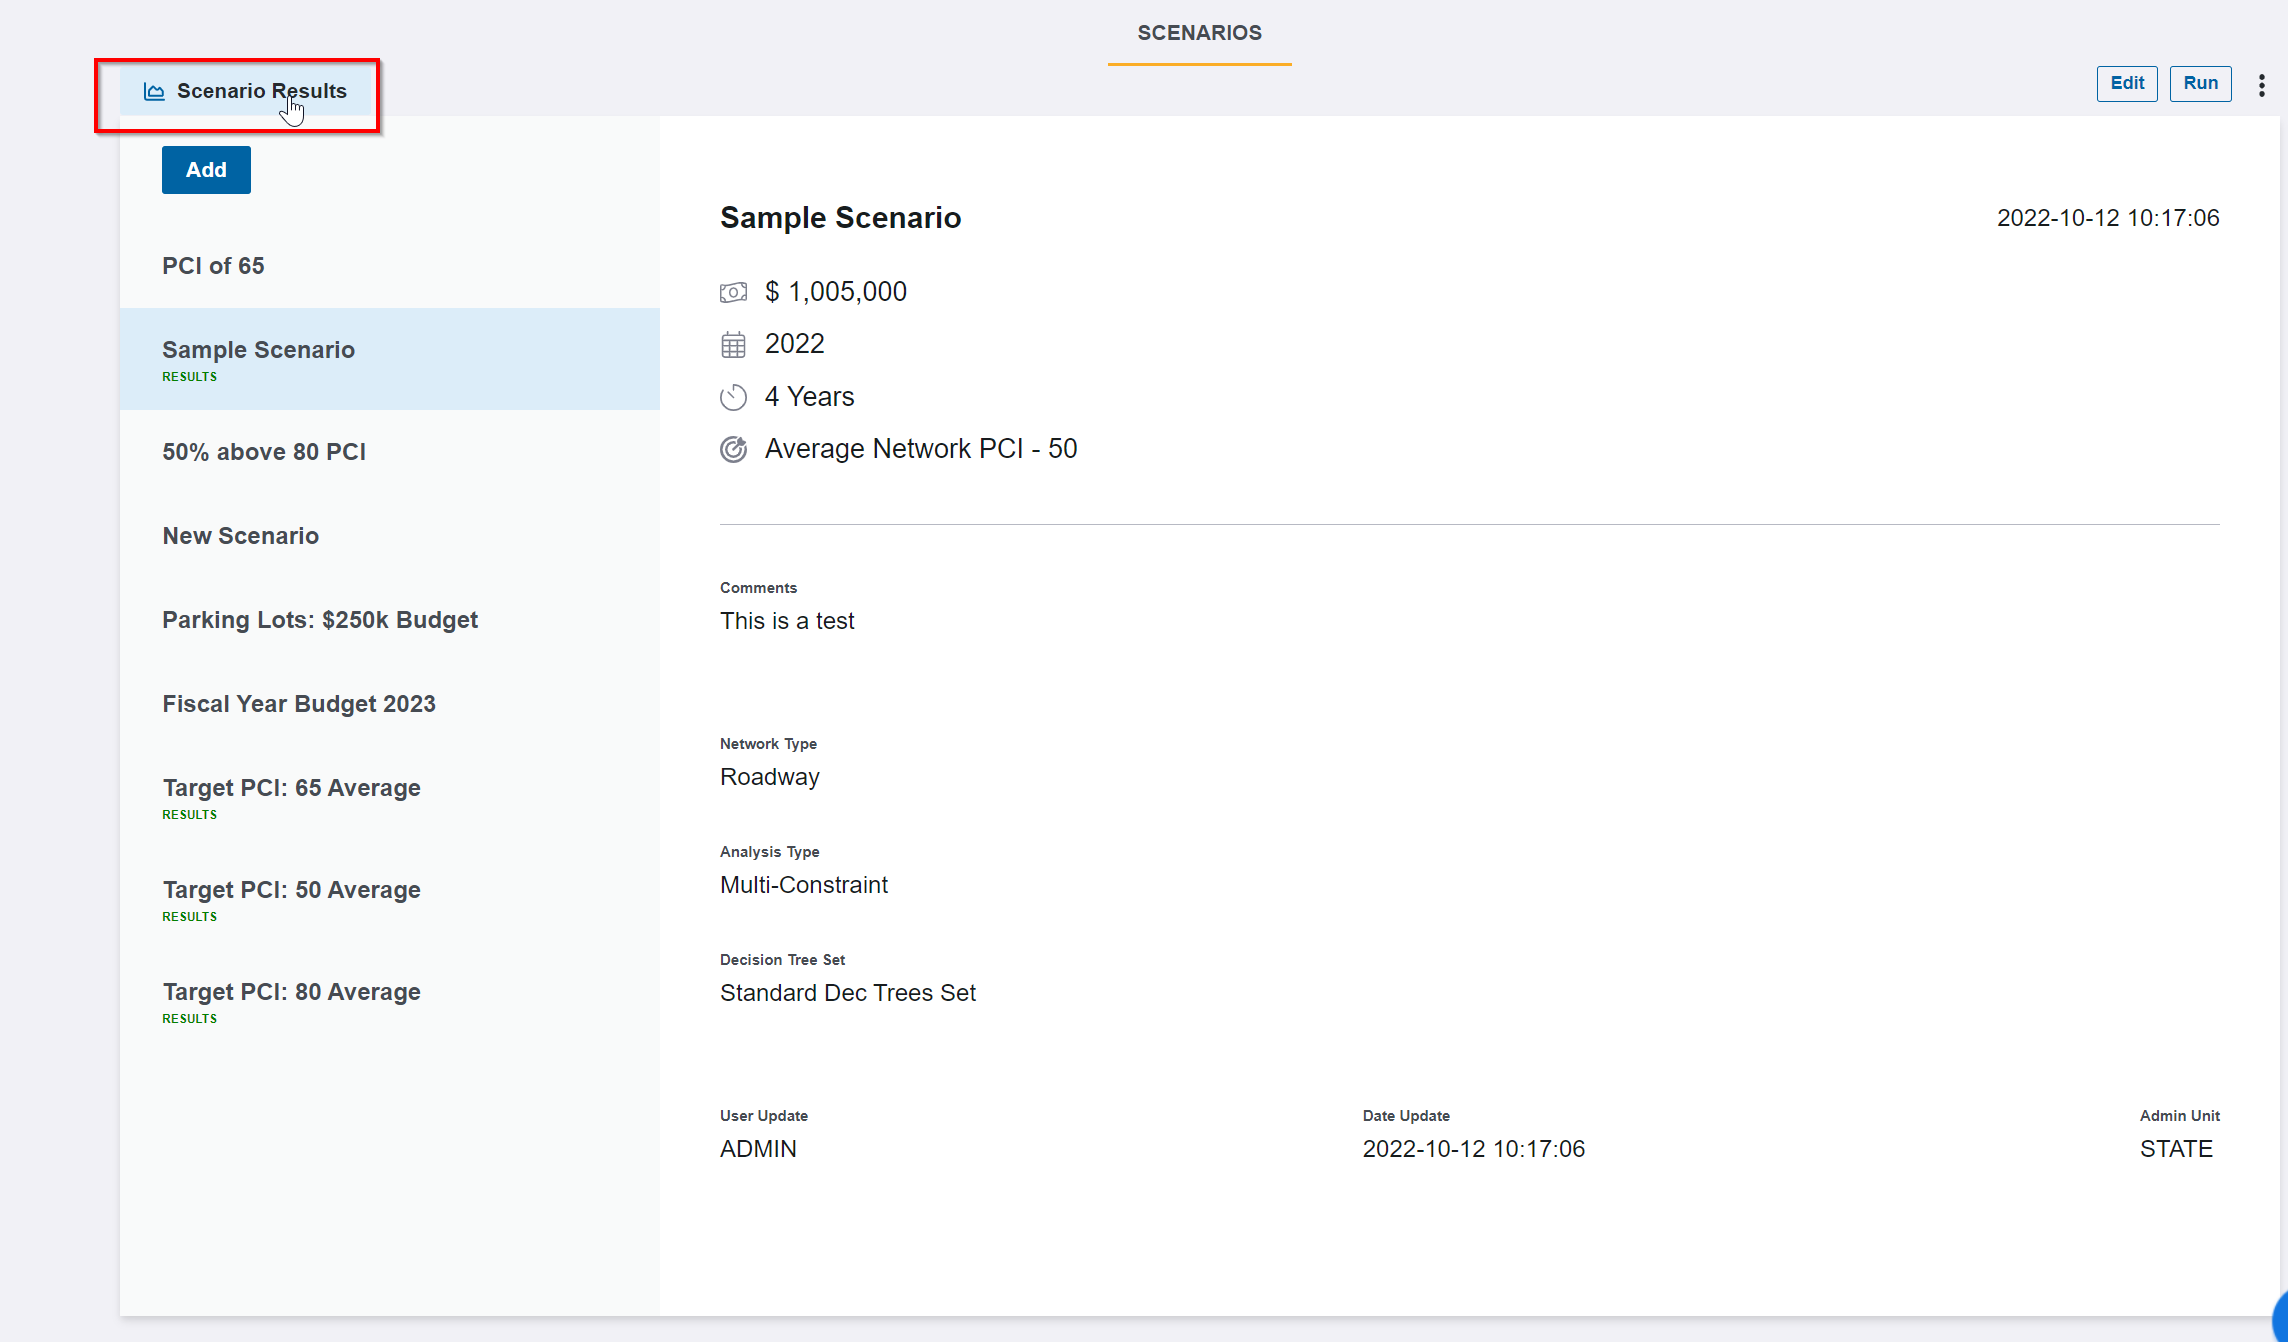
1. After the scenario process is complete, click on Scenarios Results in the upper left-hand corner of the (Scenarios) page to review the details. Click Here for Training Exercises
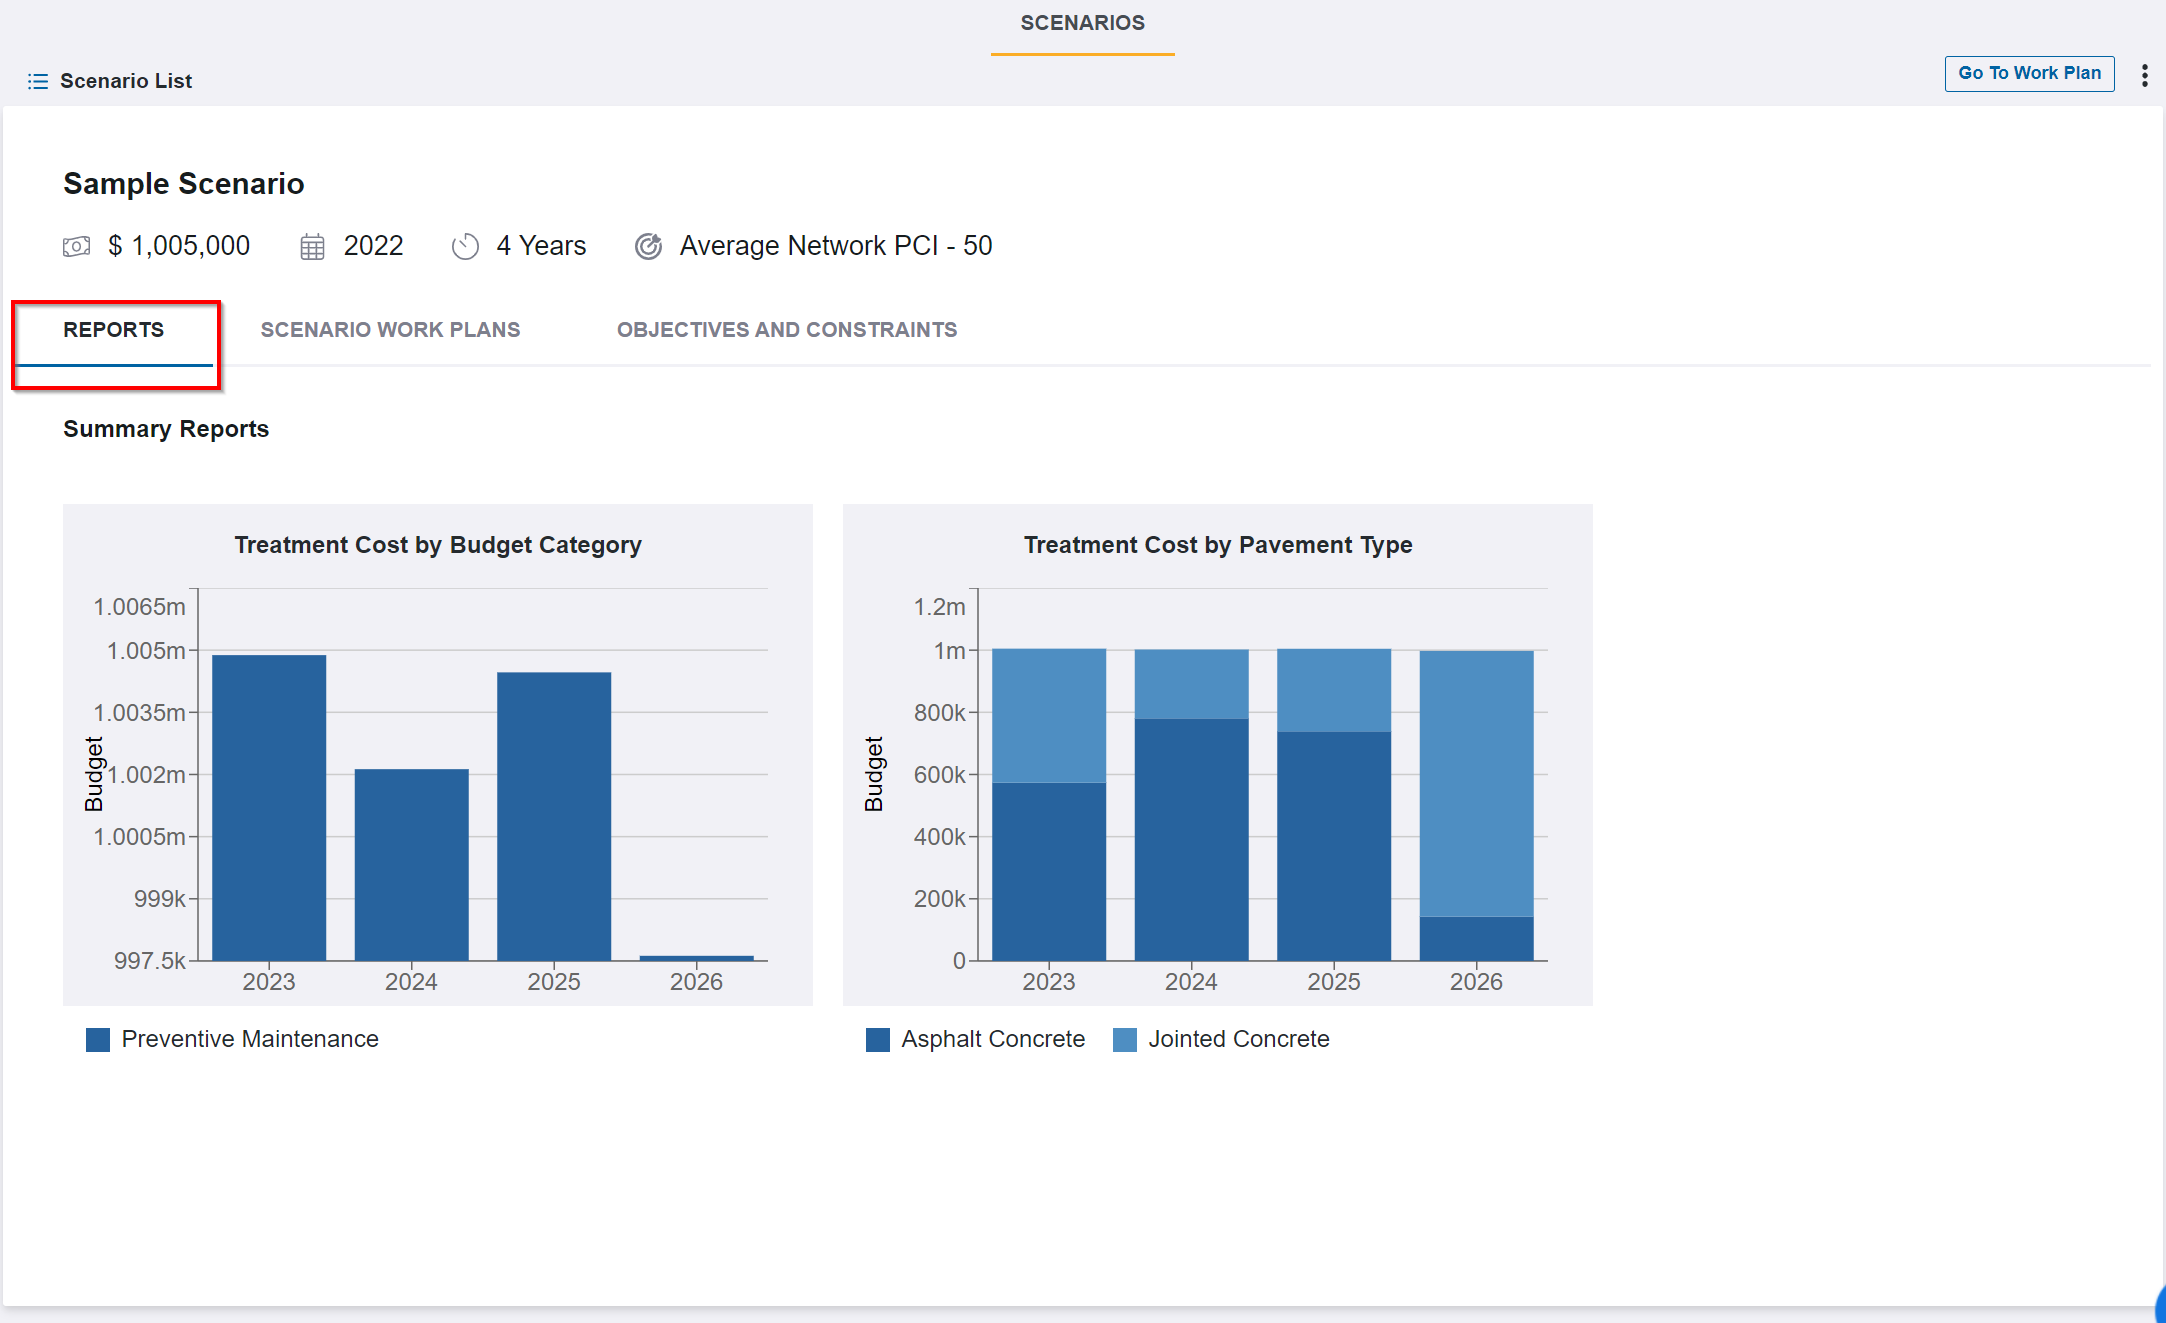
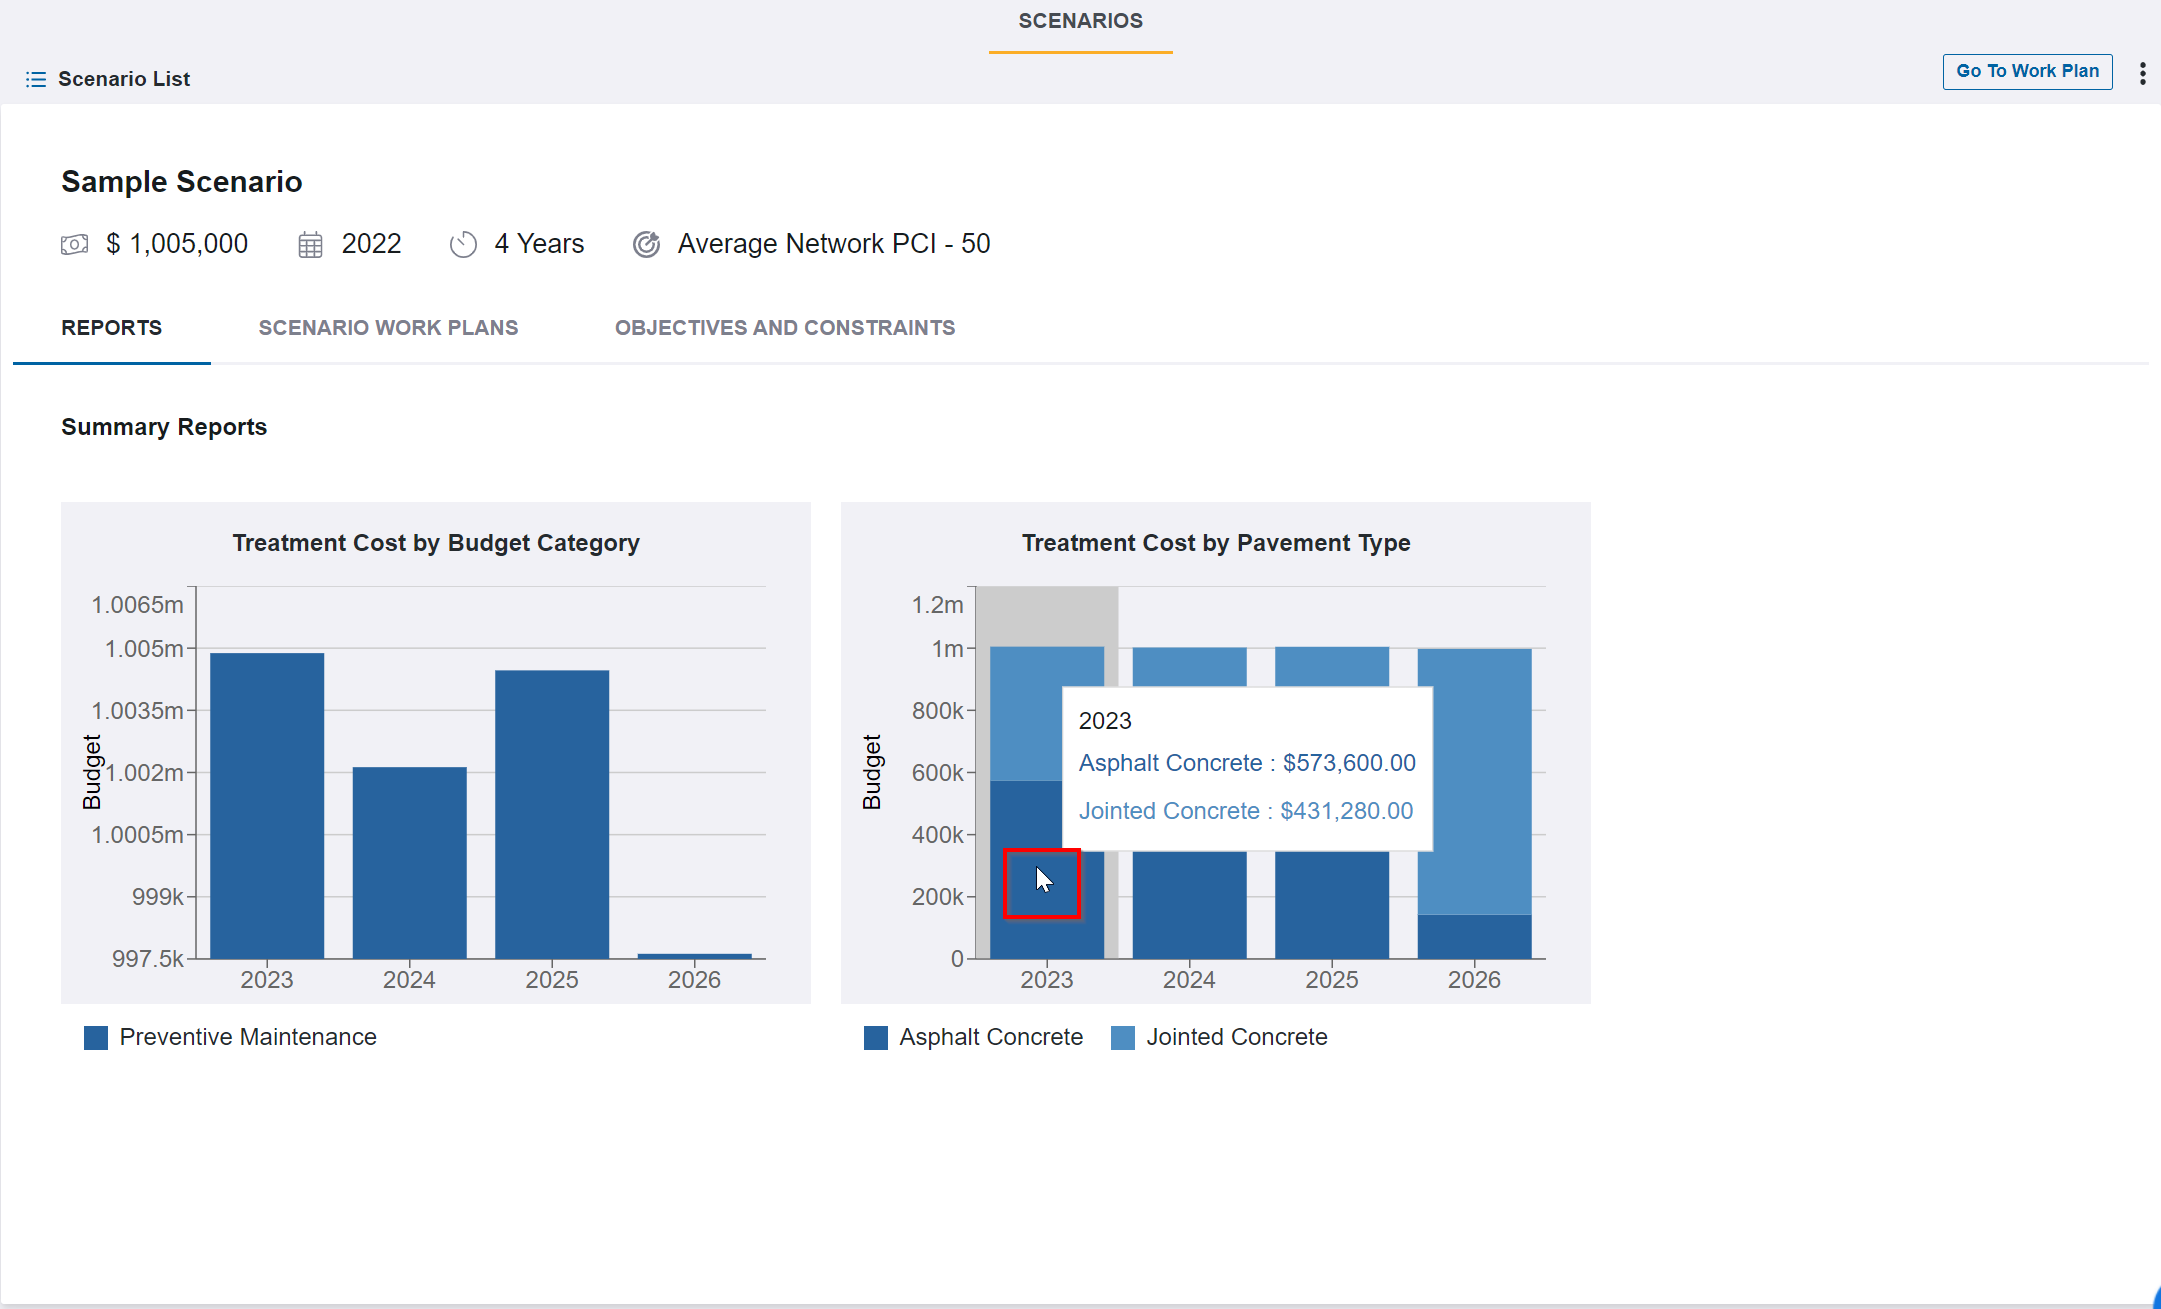
2. Click on the REOPORTS menu to access the window and review the Treatment Cost Budget Category and Treatment Cost by Pavement Type.
3. Hover your mouse over each graph report to review more details.
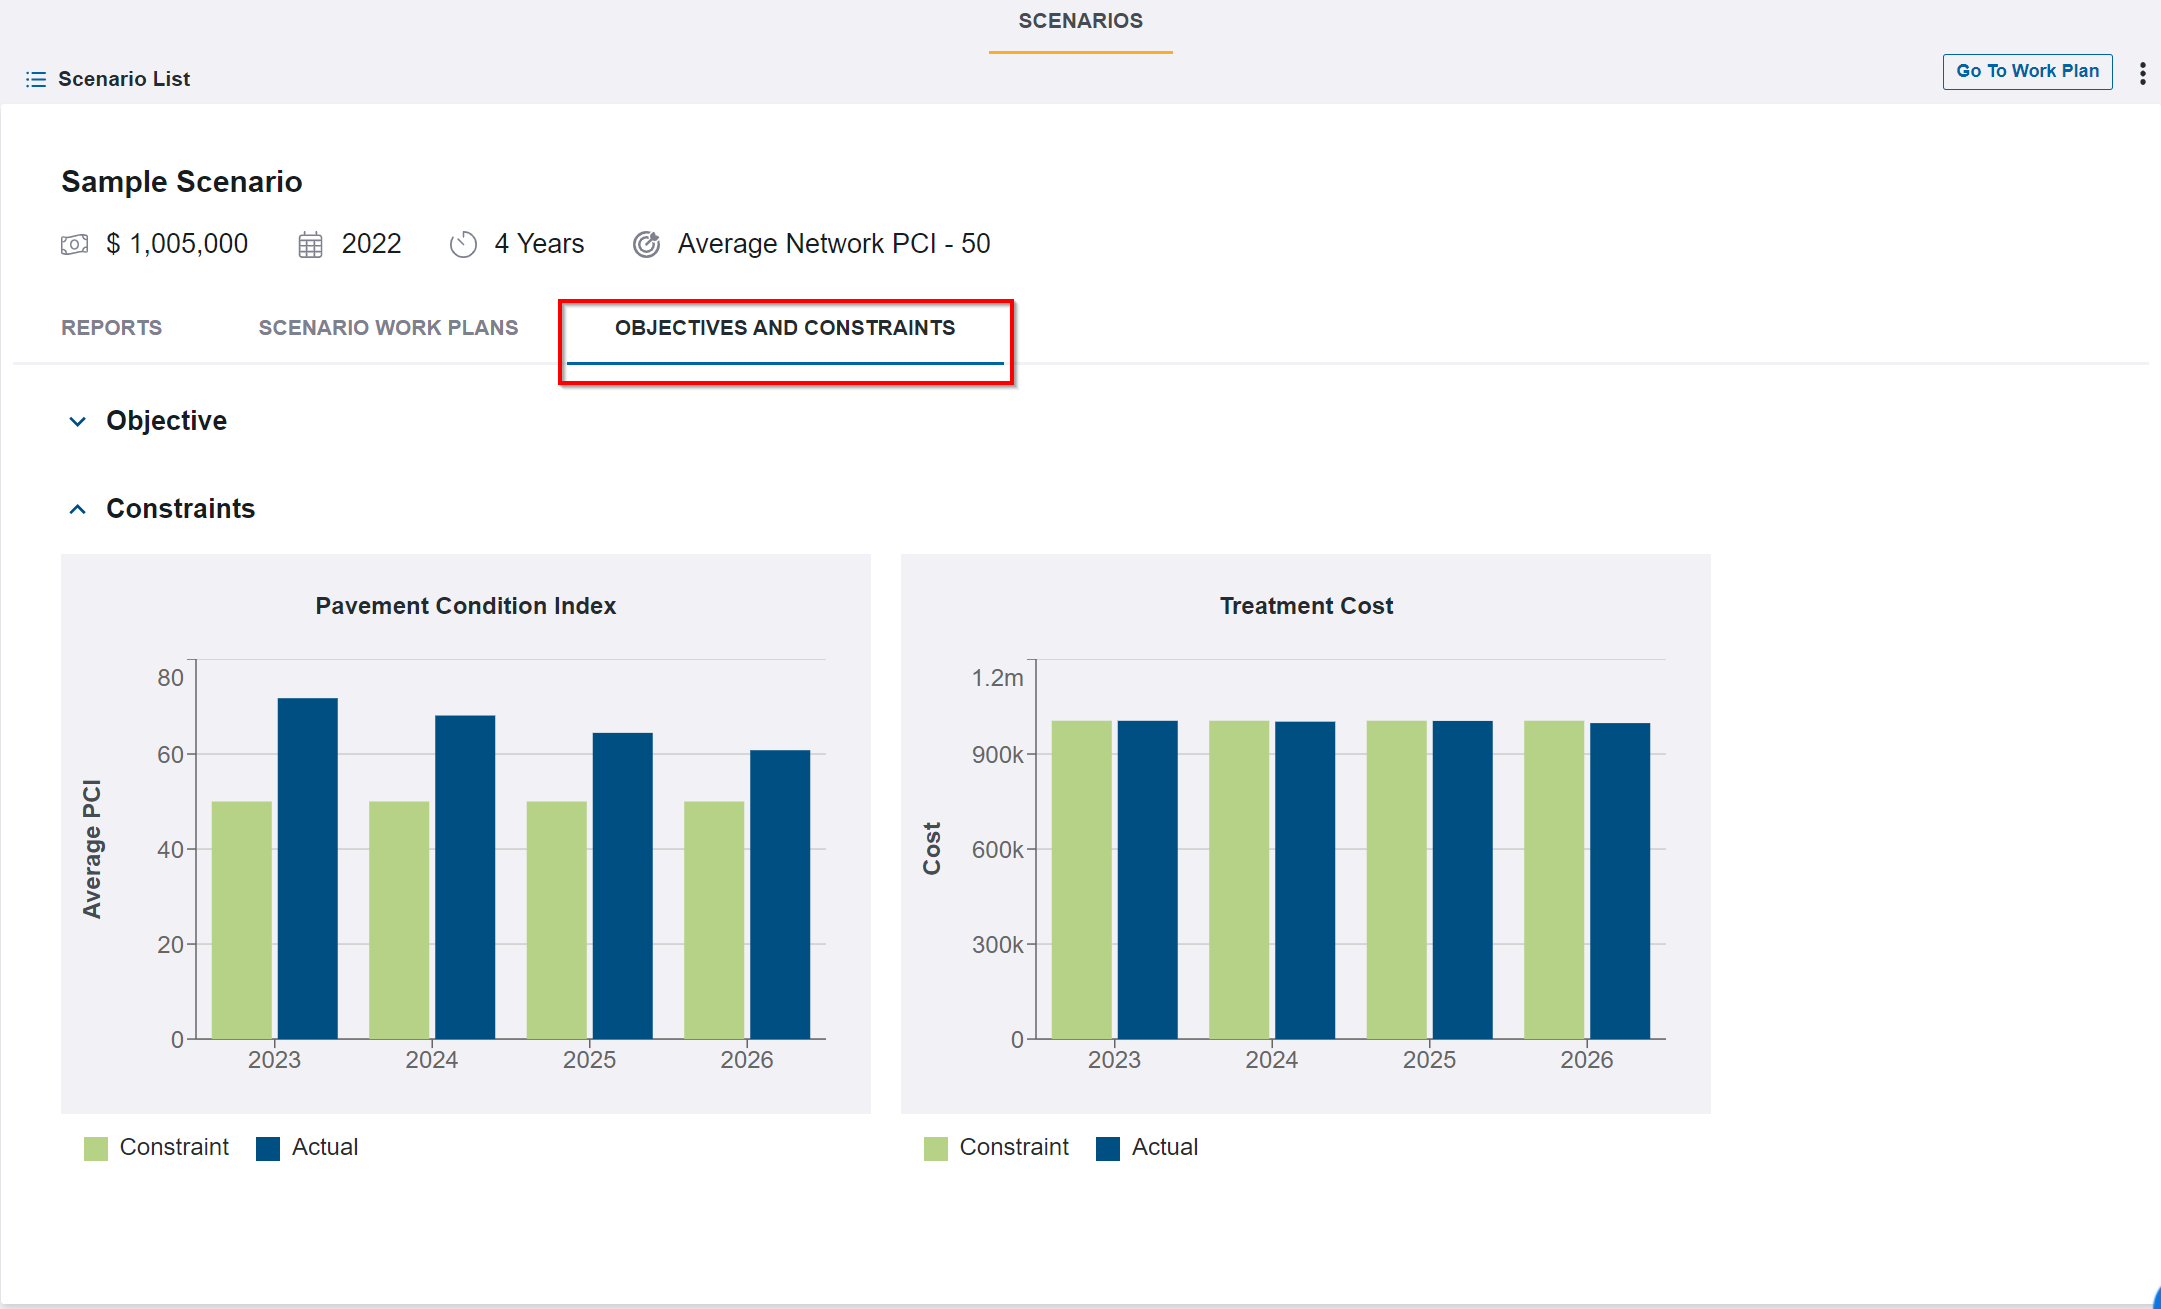
4. Click on the OBJECTIVES AND CONSTRAINTS menu to access the window and review the Pavement Condition Index and Treatment Cost.
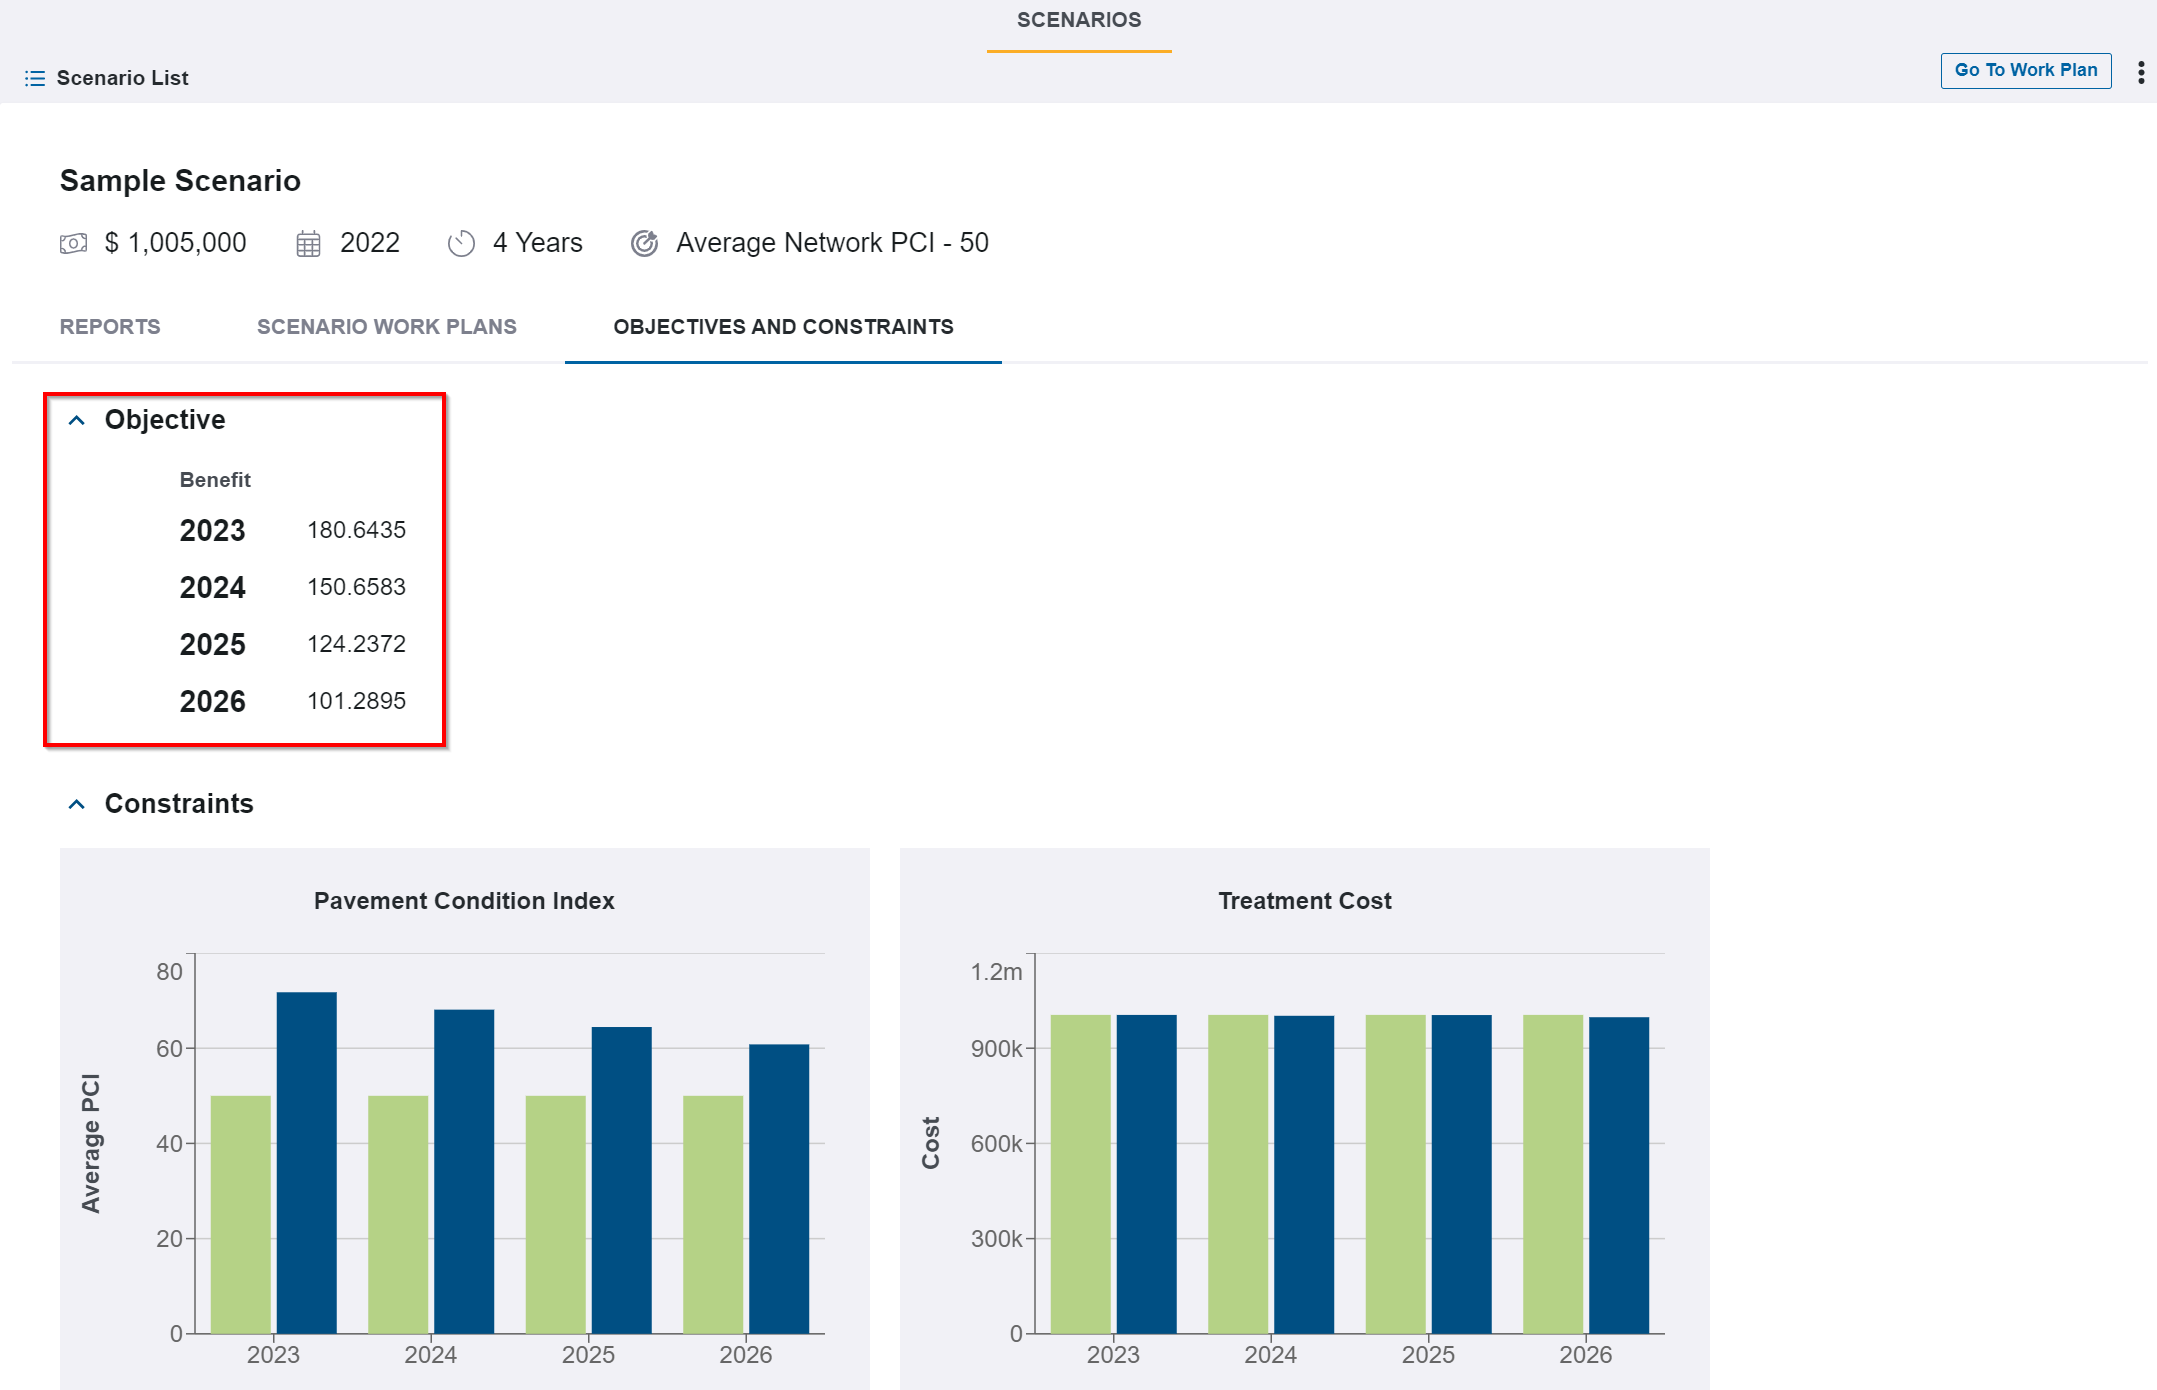
5. Click the Down Arrow adjacent to Objective to review object benefits.
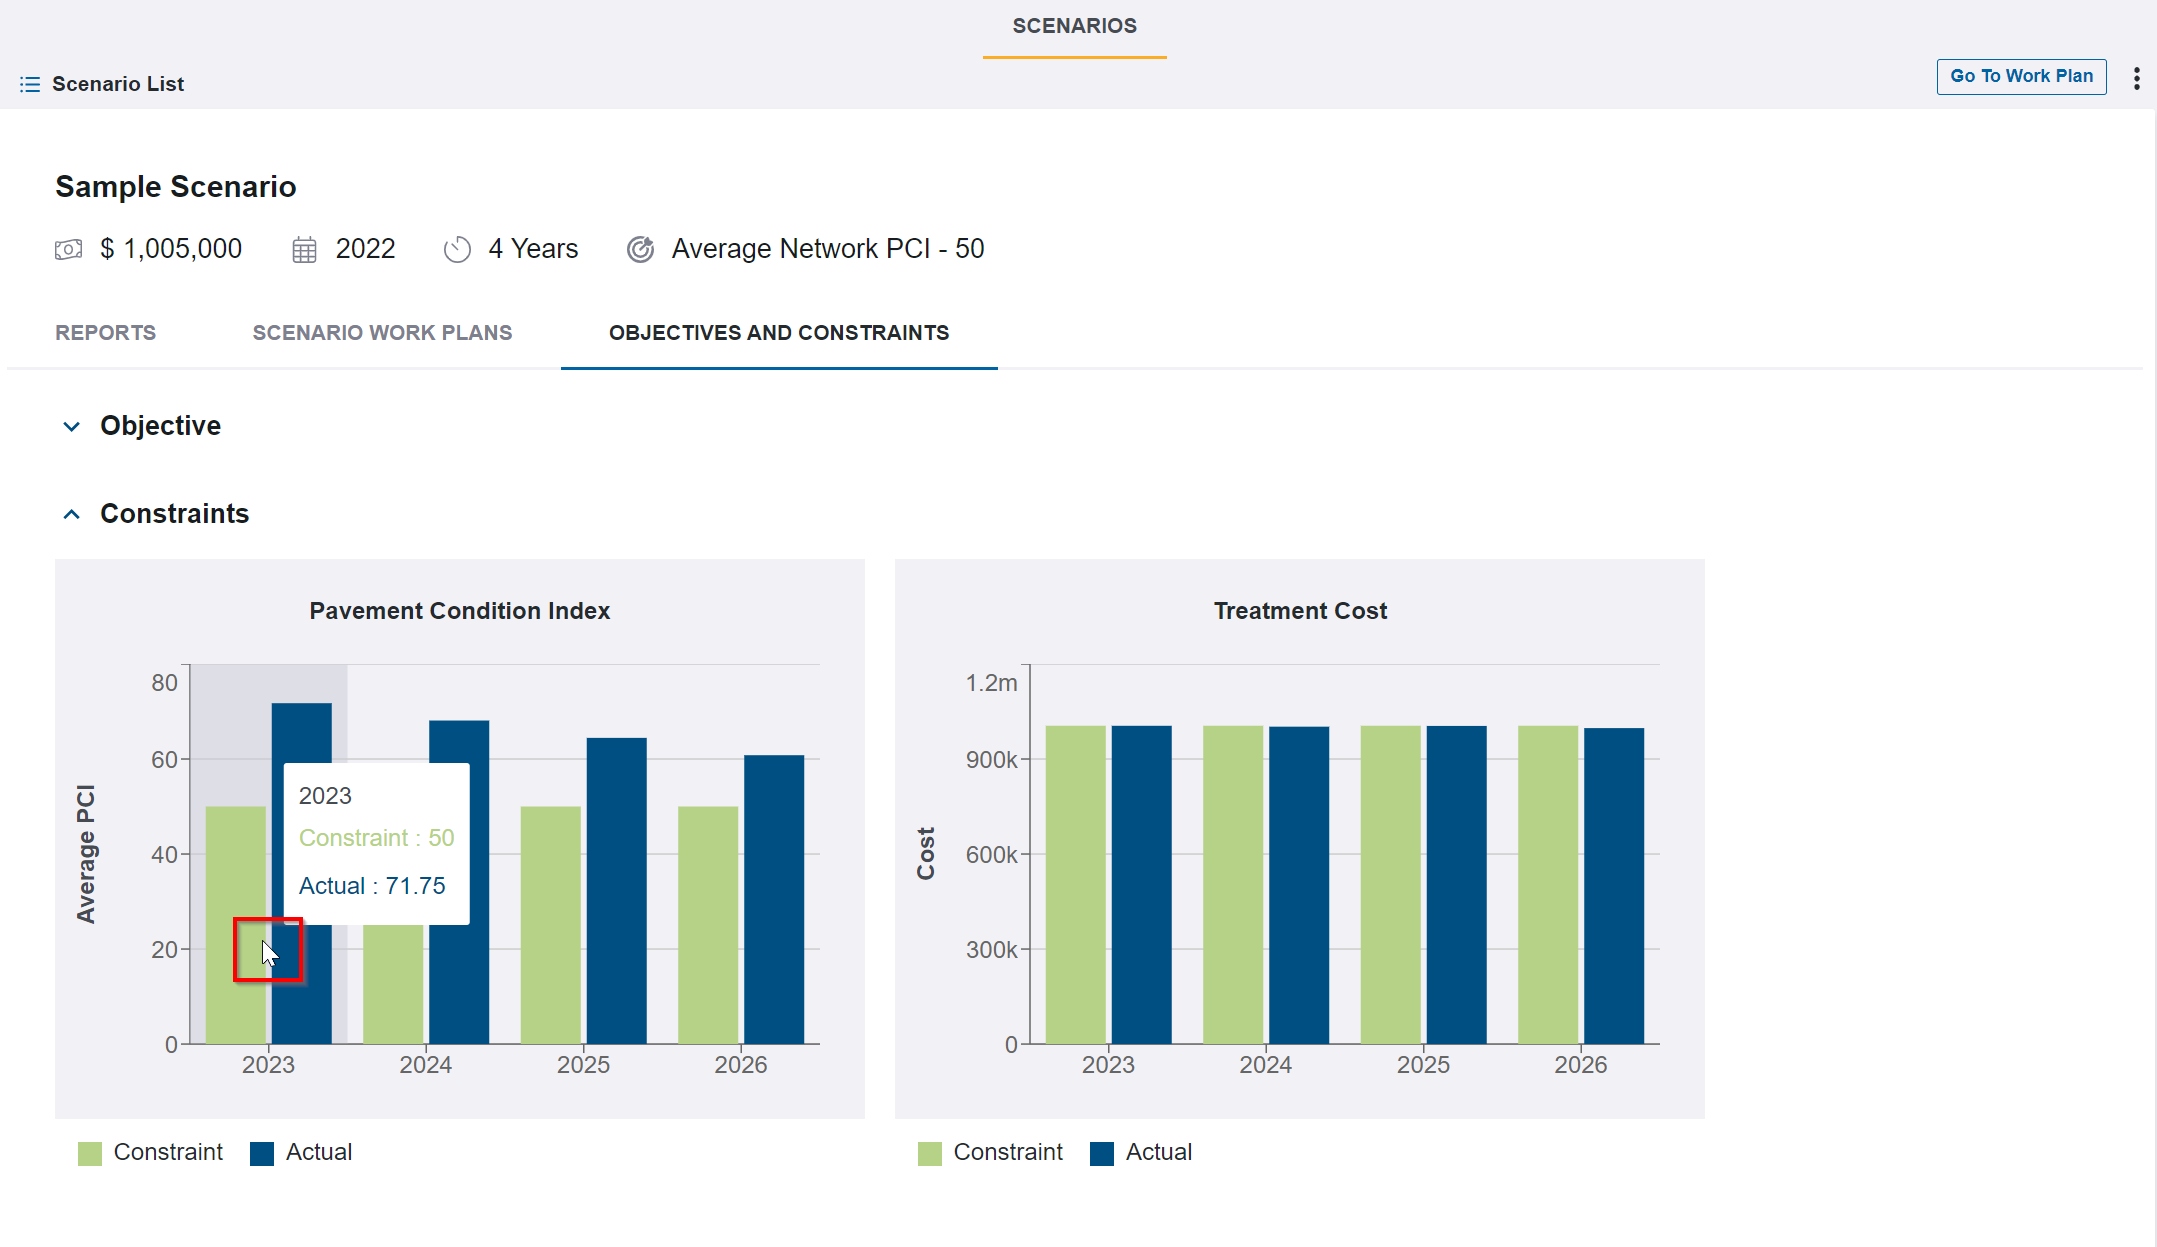
6. Hover your mouse over each graph report to review more details.
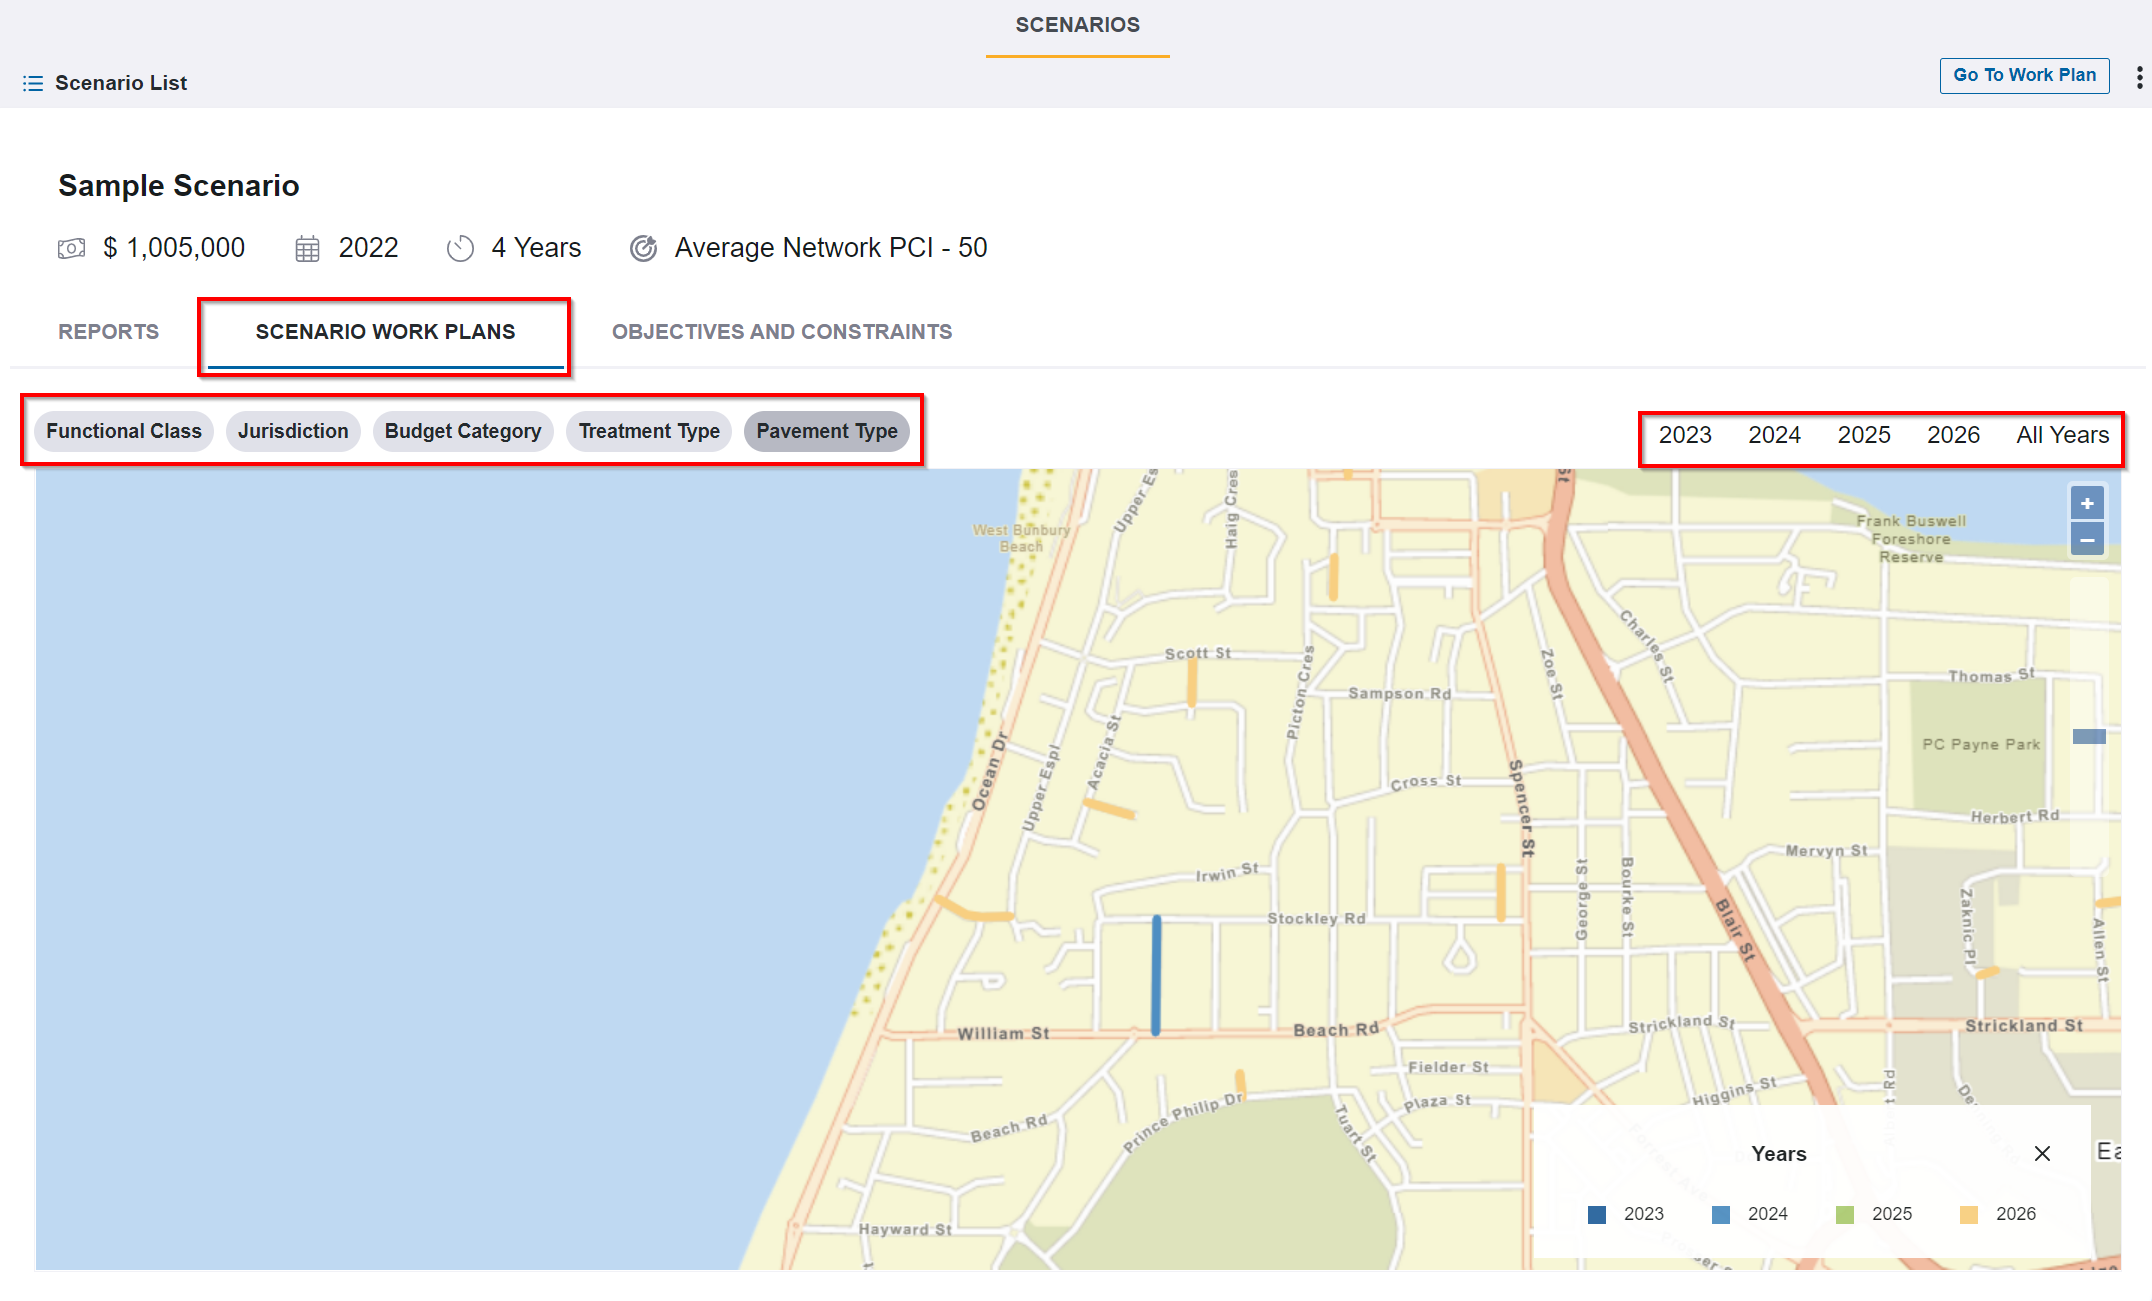
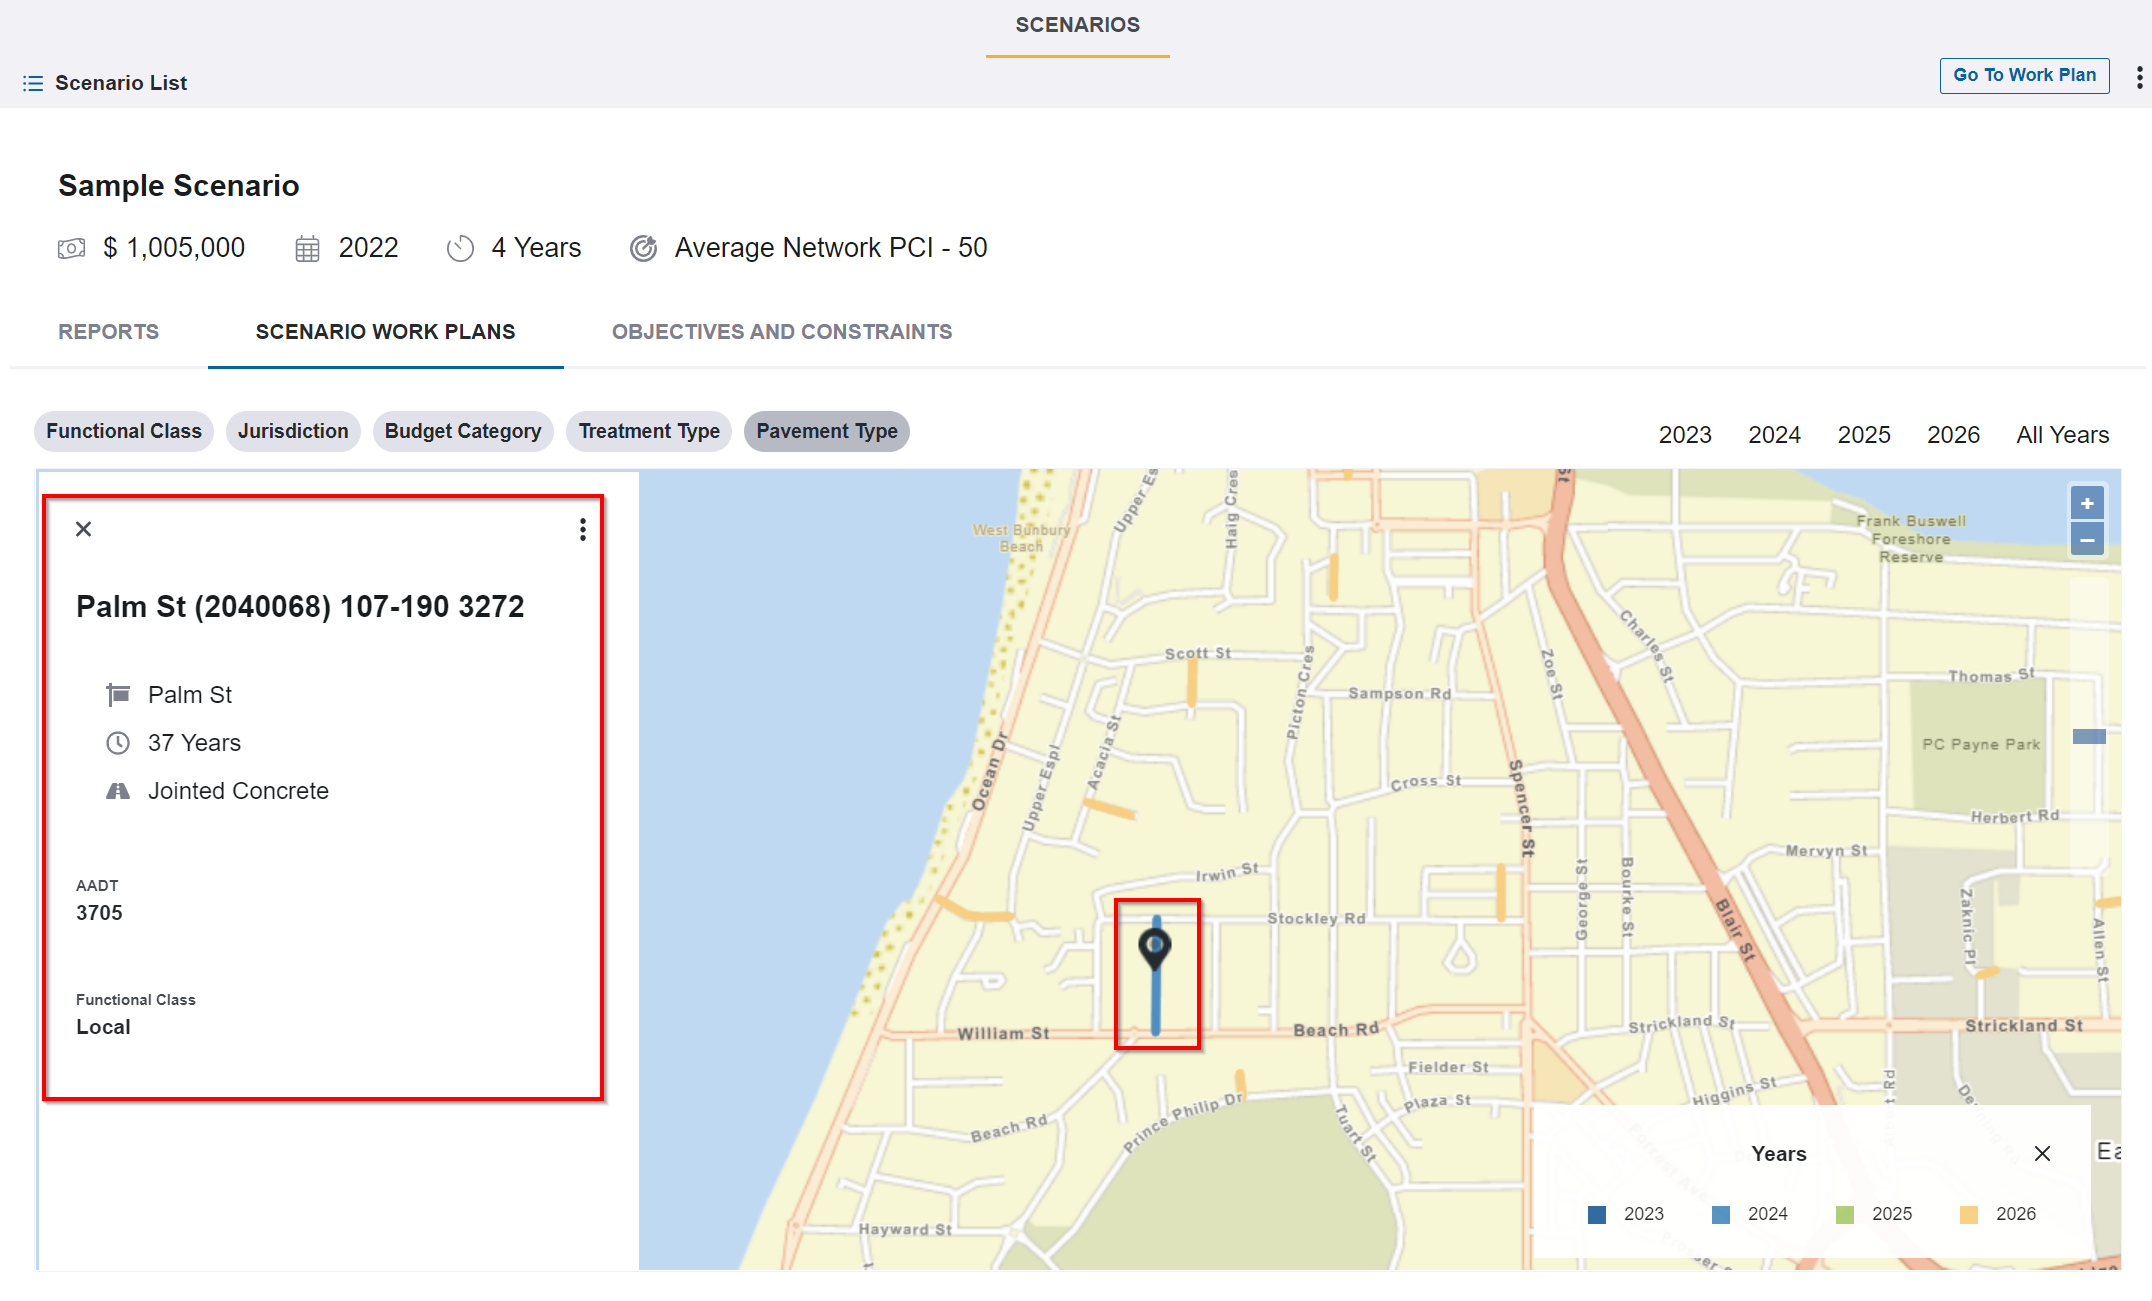
7. Click on the SCENARIO WORK PLANS menu to access the window and setup filter options that you are interested in.
8. From the Filter Bubble menus (Functional Class, Jurisdiction, Budget Category, Treatment Cost, Pavement Type), select the apply the filters of interest.
9. Next, click on the Year (2023, 2024, 2025, 2026, All Years)of interest to see the results on the map.
10. At this point, zoom in on the map and click on any of the road segments resulting from the filters you selected to see the details.
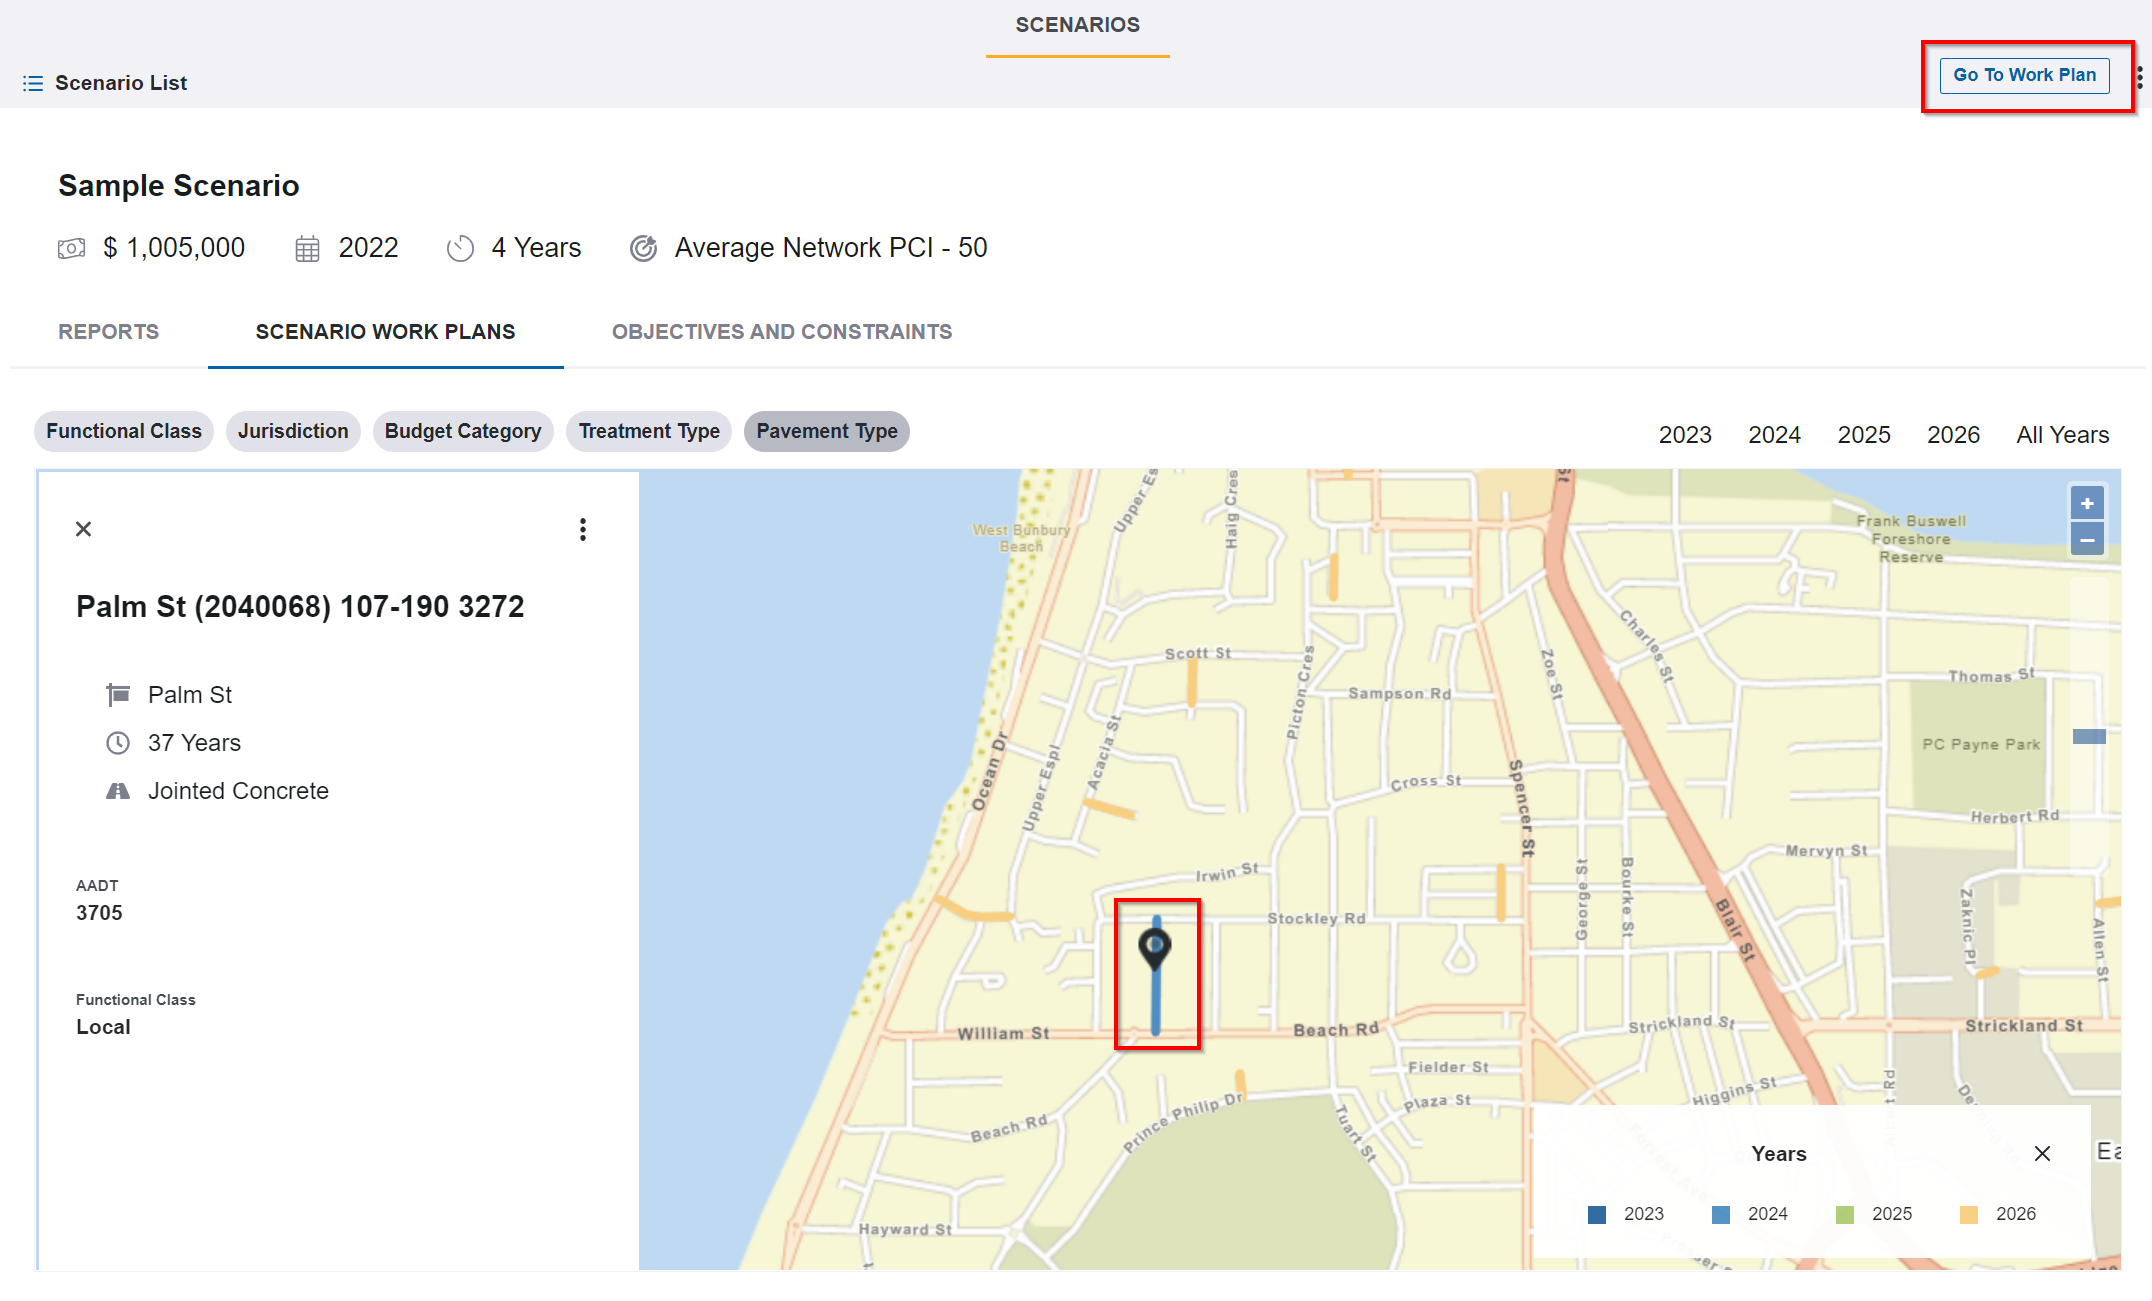
11. Finally, after reviewing the data, click on the Go to Work Plan button in the upper right-hand corner to bring up the Work Plan window. The system refreshes and displays the Master Work Plan window with all of the Work plans from your Work Plan Scenario.
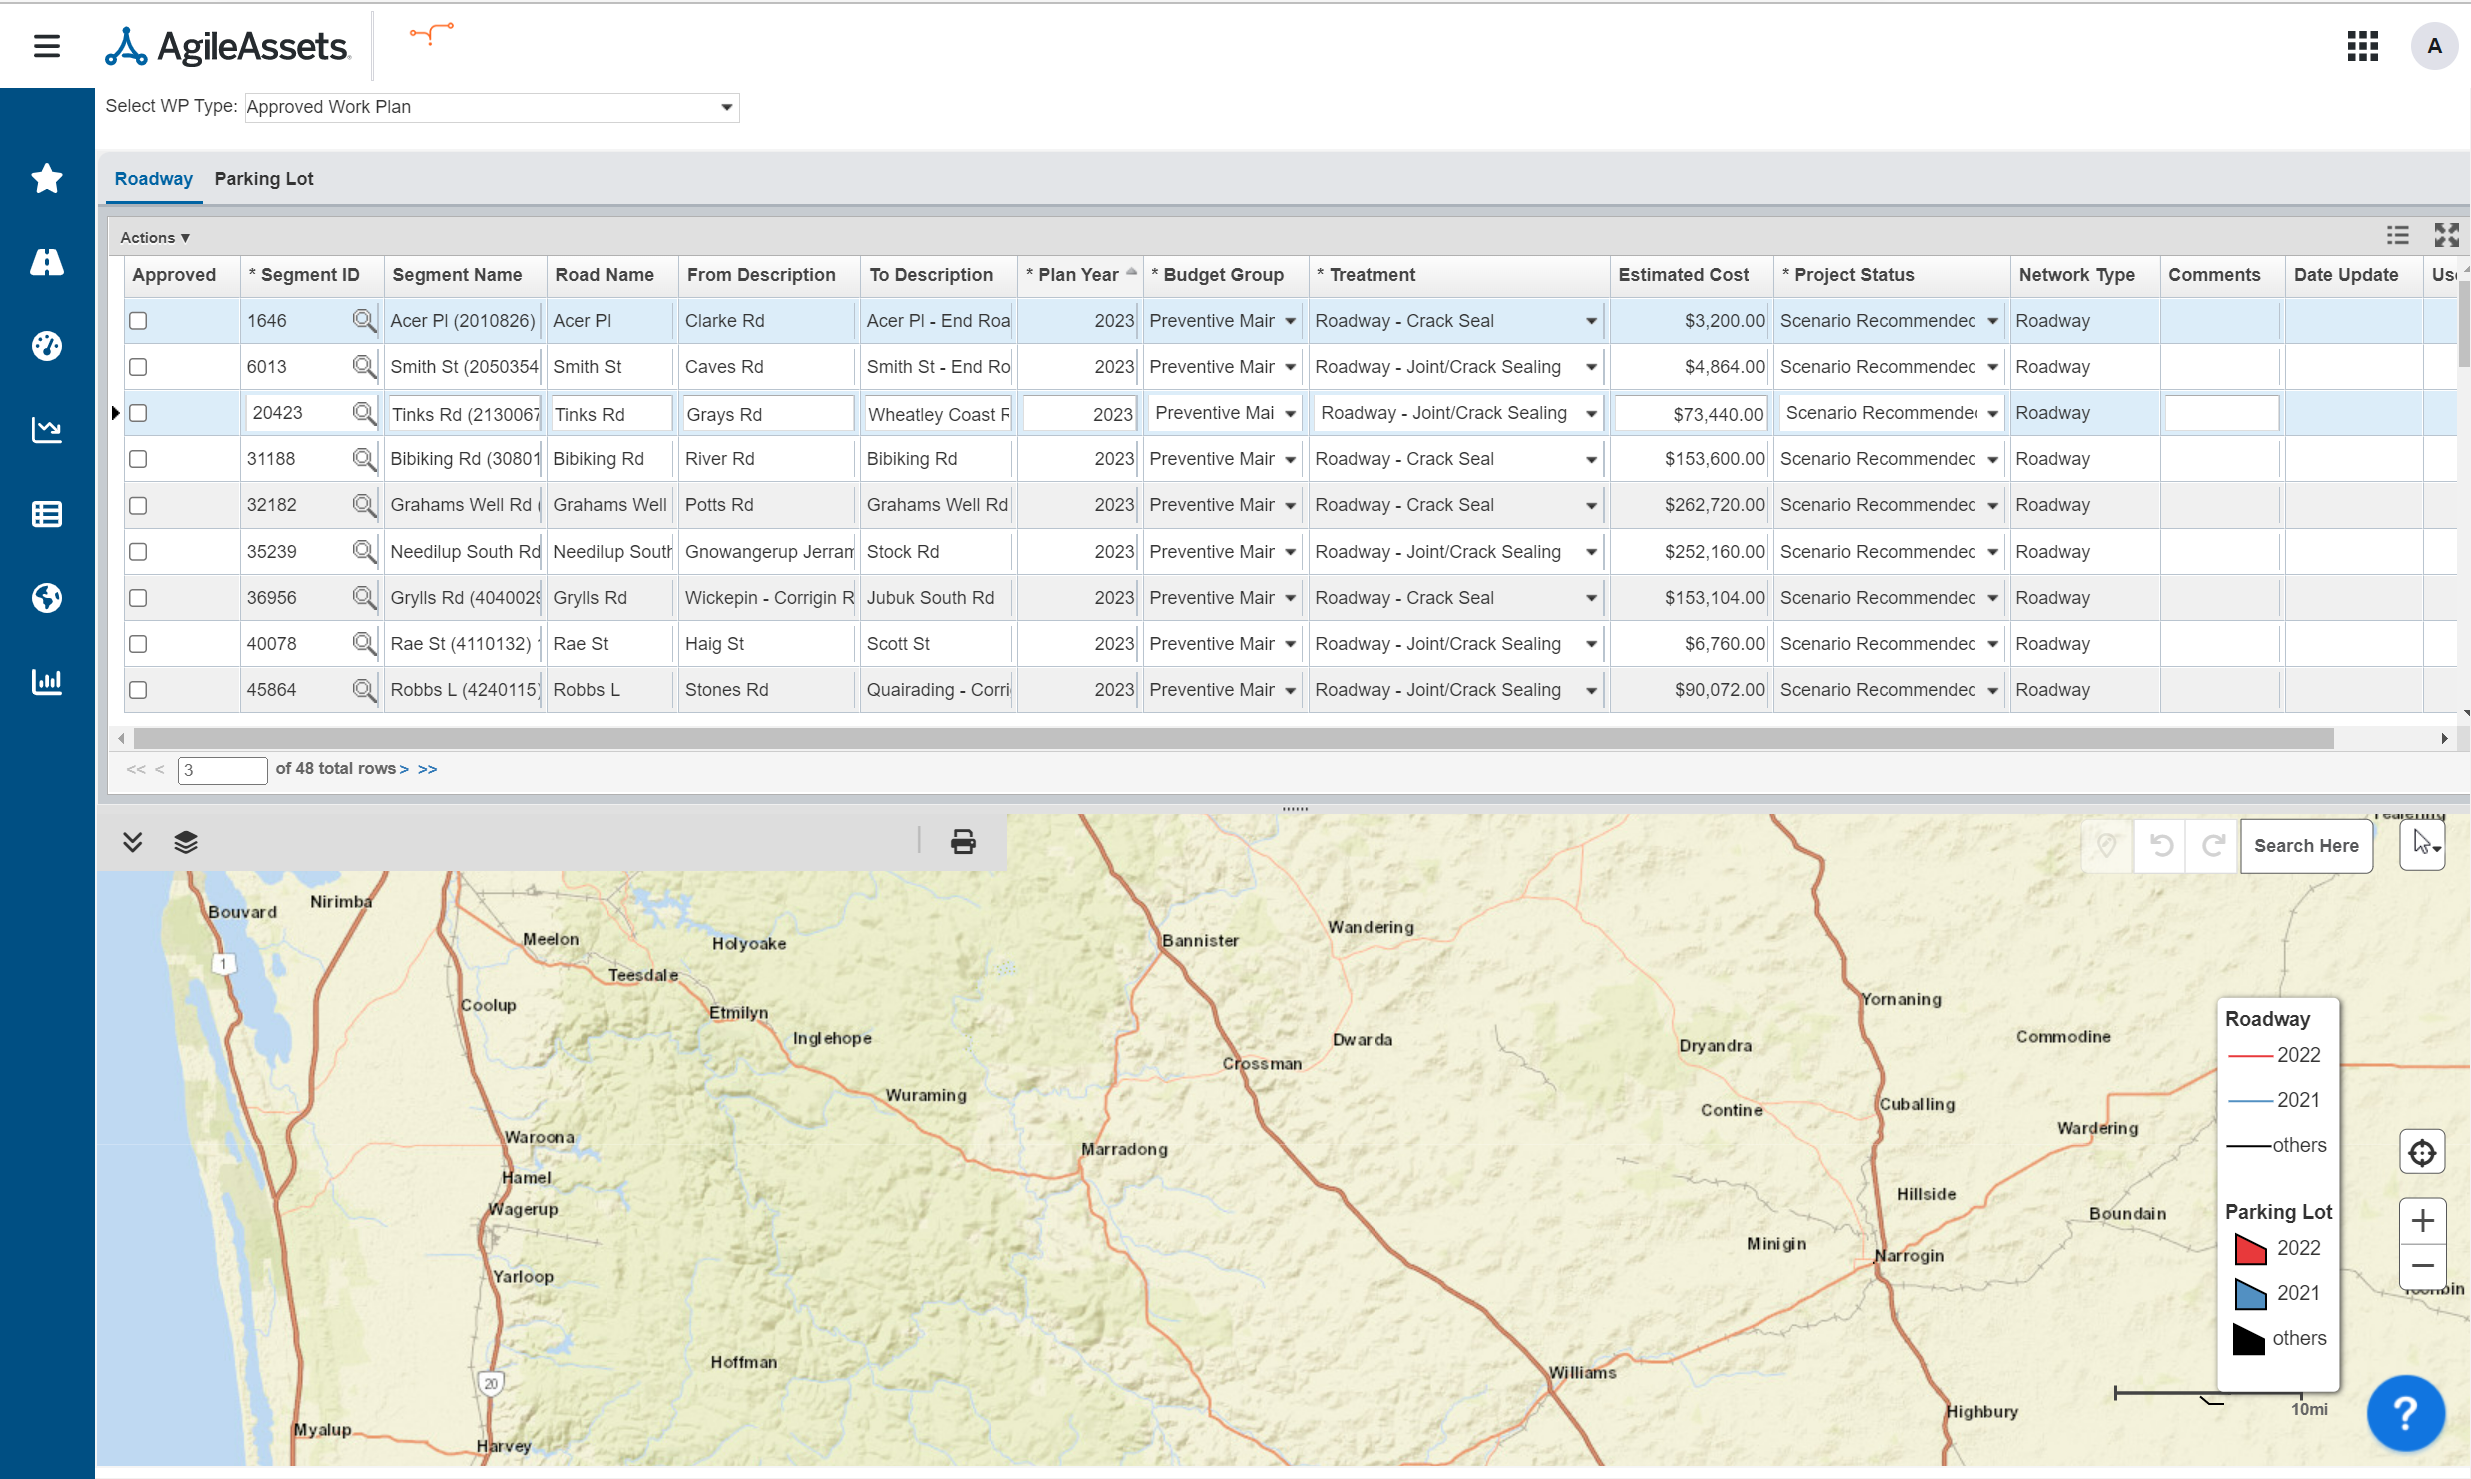
| Children Display | ||
|---|---|---|
|