...
- Navigate to Safety > Diagnostics > Safety Diagnostics Shortlist Window. The window contains two panes:
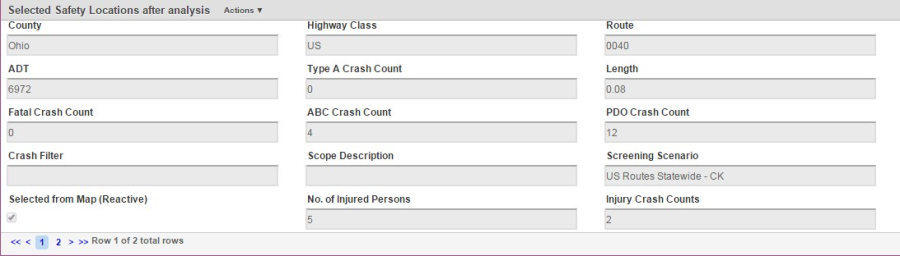
- The top pane is Selected Safety locations after analysis.
- The lower pane is locations for projects. The locations for projects will be discussed in detail in the chapter Project planning and analysis.
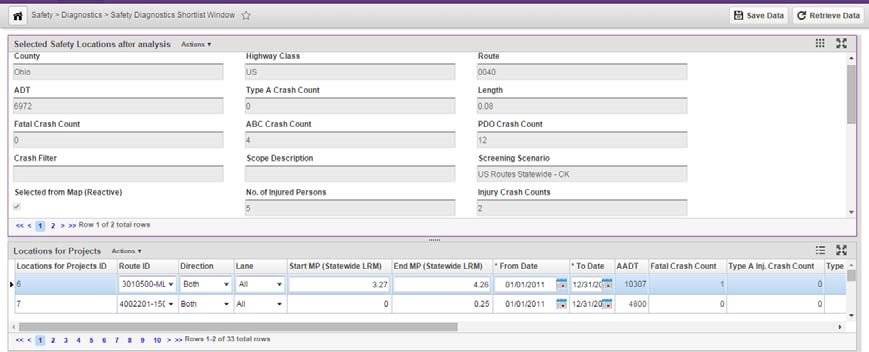
- The Selected Safety locations after analysis is a view only pane. The locations that are identified from the Reactive- Hotspots & GIS Window and Road Safety Profile Viewer are listed in this pane.
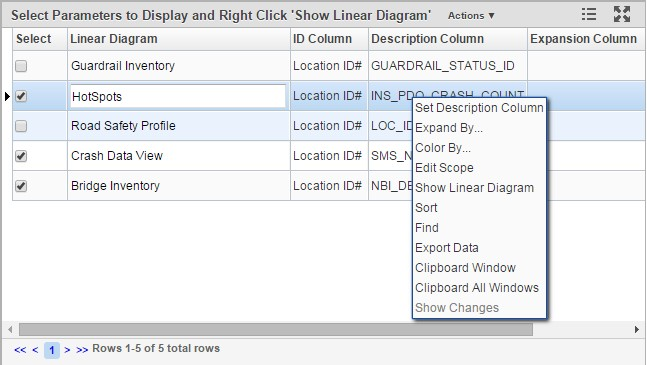
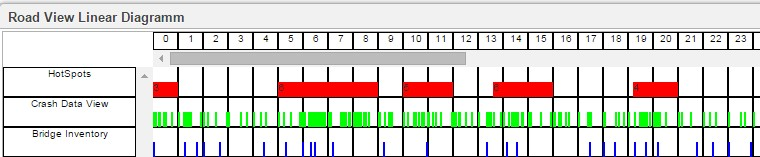
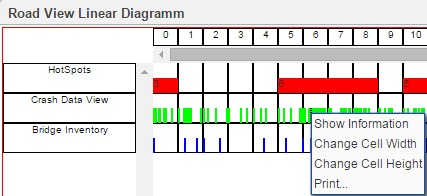
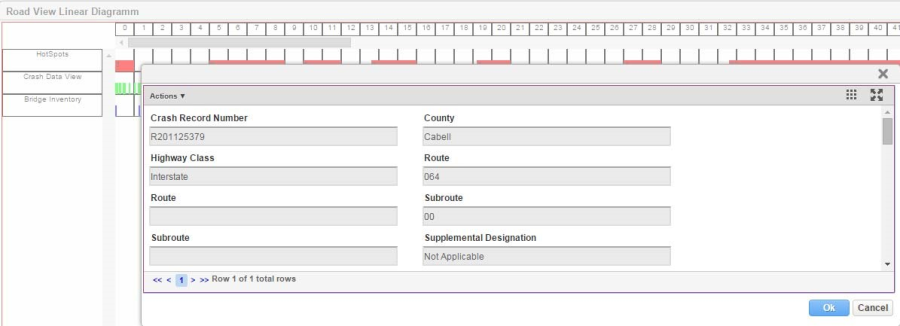
- Right-click on the graph and select Show Information. A new pop-up window opens and dispalys information of the selected data.
...
...
Note: Not all datasets plotted in the linear diagram will have data that will display in the popup window. Display of data in this pop-up window is
...
dependant on the
...
configuartaion of the data's link
...
targetThe link target can be verified in Road View Setup (Safety > Setup > Road View Setup) window.
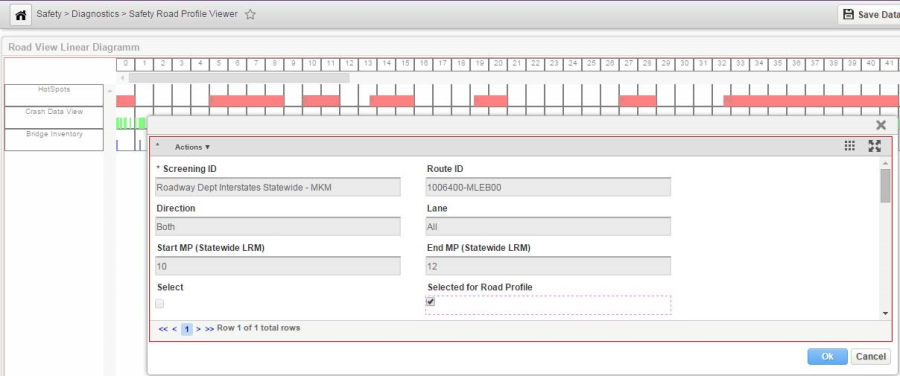
- Along with the additional information that can be gleaned from the additional parameters, use the right-click, Show Information option to review the hotspots. , Check the Select option for the corresponding row of those hotspots that are determined to need to be considered for the development of a project.
Info
Note: Once the locations are selected, further analysis can be performed at a later stage. This will be covered in the later part of the tutorial.
7. Click the Save button. Hotspots that were selected will now appear in the Locations Shortlist Window.