How to Perform Diagnostics for Reactive- Hotspots & GIS
The Reactive-Hotspots & GIS window is used to view the hotspots (results from network screenings) on the GIS map. Using the GIS functionality and other layers available in the system can help in making the decision of whether or not to consider a hotspot for further analysis.
In order to perform diagnostics for the hotspots identified using screening, follow these steps:
- Navigate to Safety > Diagnostics > Reactive- Hotspots & GIS.
Note: This window has one dropdown selection and two panes. The dropdown selection lists all the screening scenarios performed which have hotspots. Once user selects a screening scenario, the hotspots related to the corresponding scenario are displayed on the left pane. The right-pane displays the map highlighting the selected feature.
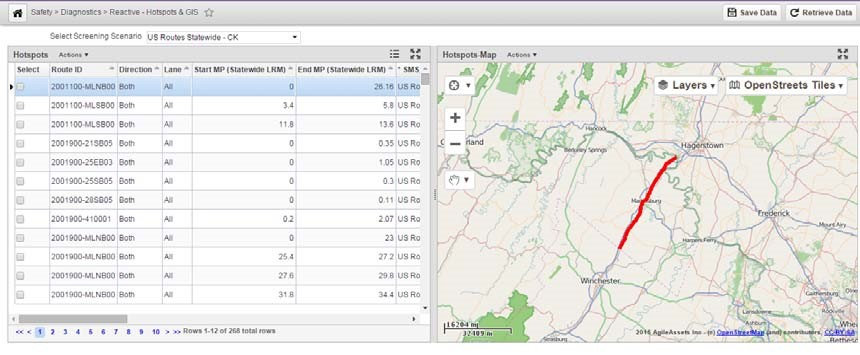
- Select a screening scenario from the dropdown.
- The left-pane is refreshed by the data (hotspots) from the screening analysis that was previously performed.
- Select a row, the row is highlighted and the map on the right-pane is refreshed with the highlighted feature. Multiple rows can be selected by pressing Ctrl while selecting the rows.
Note: The right-pane is similar to the GIS Explorer window. Therefore, additional layers can be added and symbology can be changed etc.
- After reviewing the hotspots, check the box in the Select column for the corresponding row of the hotspots that are determined to be location(s) for which a project may need to be developed.
Note: Once the locations are selected, further analysis can be performed at a later stage. This will be covered in the later part of the tutorial.
Click the Save button. The hotspots that were selected will now appear in the Locations