This section describes various outputs of an optimization analysis and how they can be used by the user to facilitate the decision-making process. These outputs can be categorized into results, reports, and work plans.
Scenario Work Plan Results
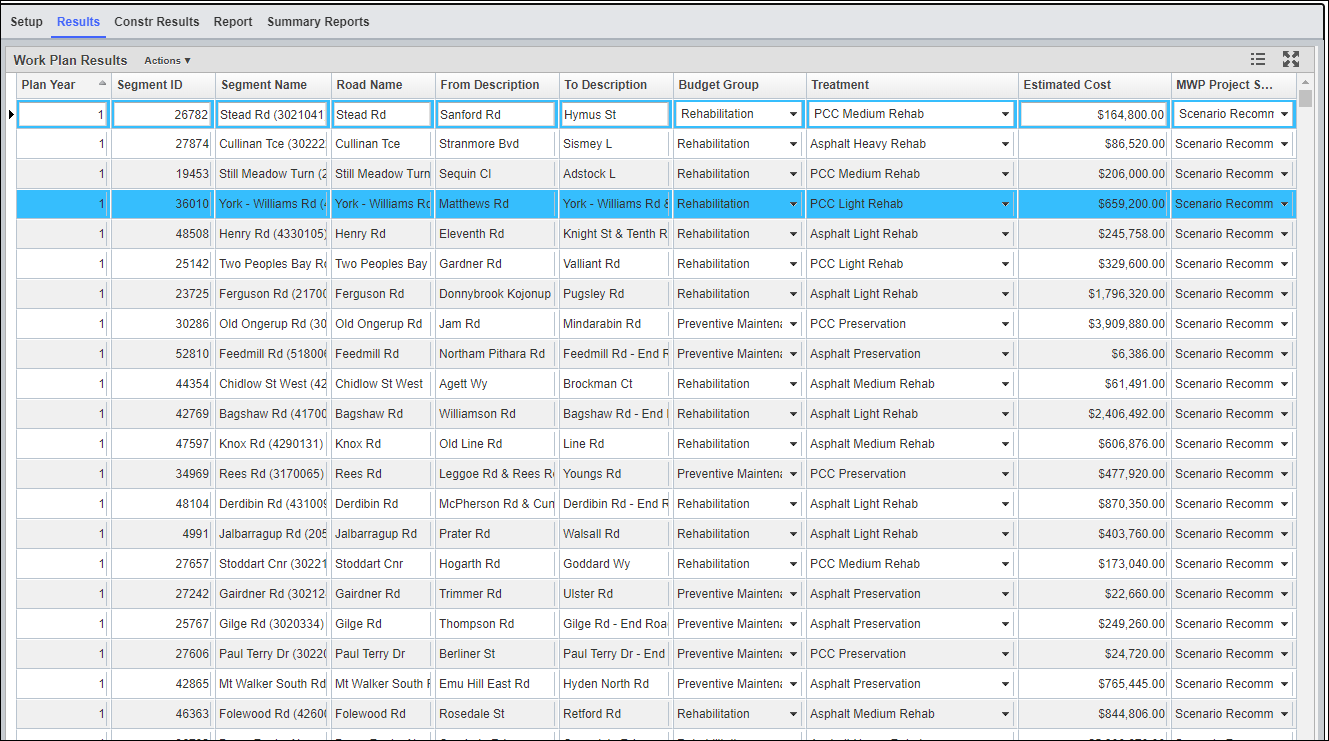
The Results tab of the Optimization Analysis window provides a list of work plans produced by the optimization routine, based upon the input criteria configured in the Setup tab. These pavement sections constitute the recommended work plan.
When you right-click this pane, the system displays a shortcut menu. This menu contains Update Cost command that can be used for re-calculating the cost for the selected record.
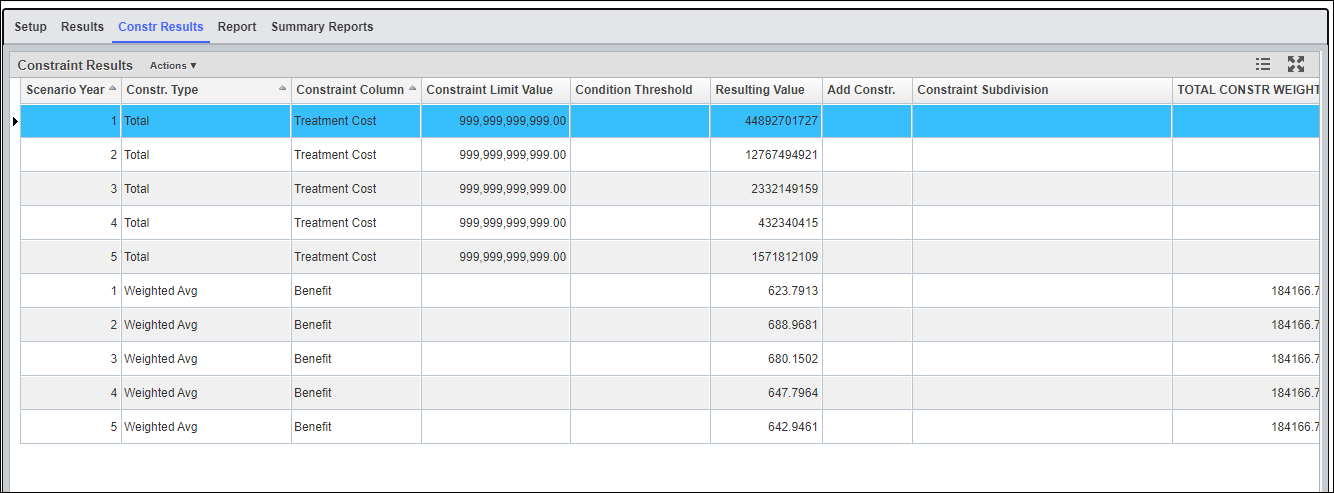
Constraints Results
The Constr. Results tab of the Optimization Analysis window shows the predicted values of each constraint compared to the input constraint value. This allows you to identify the constraints that have controlled the analysis results.
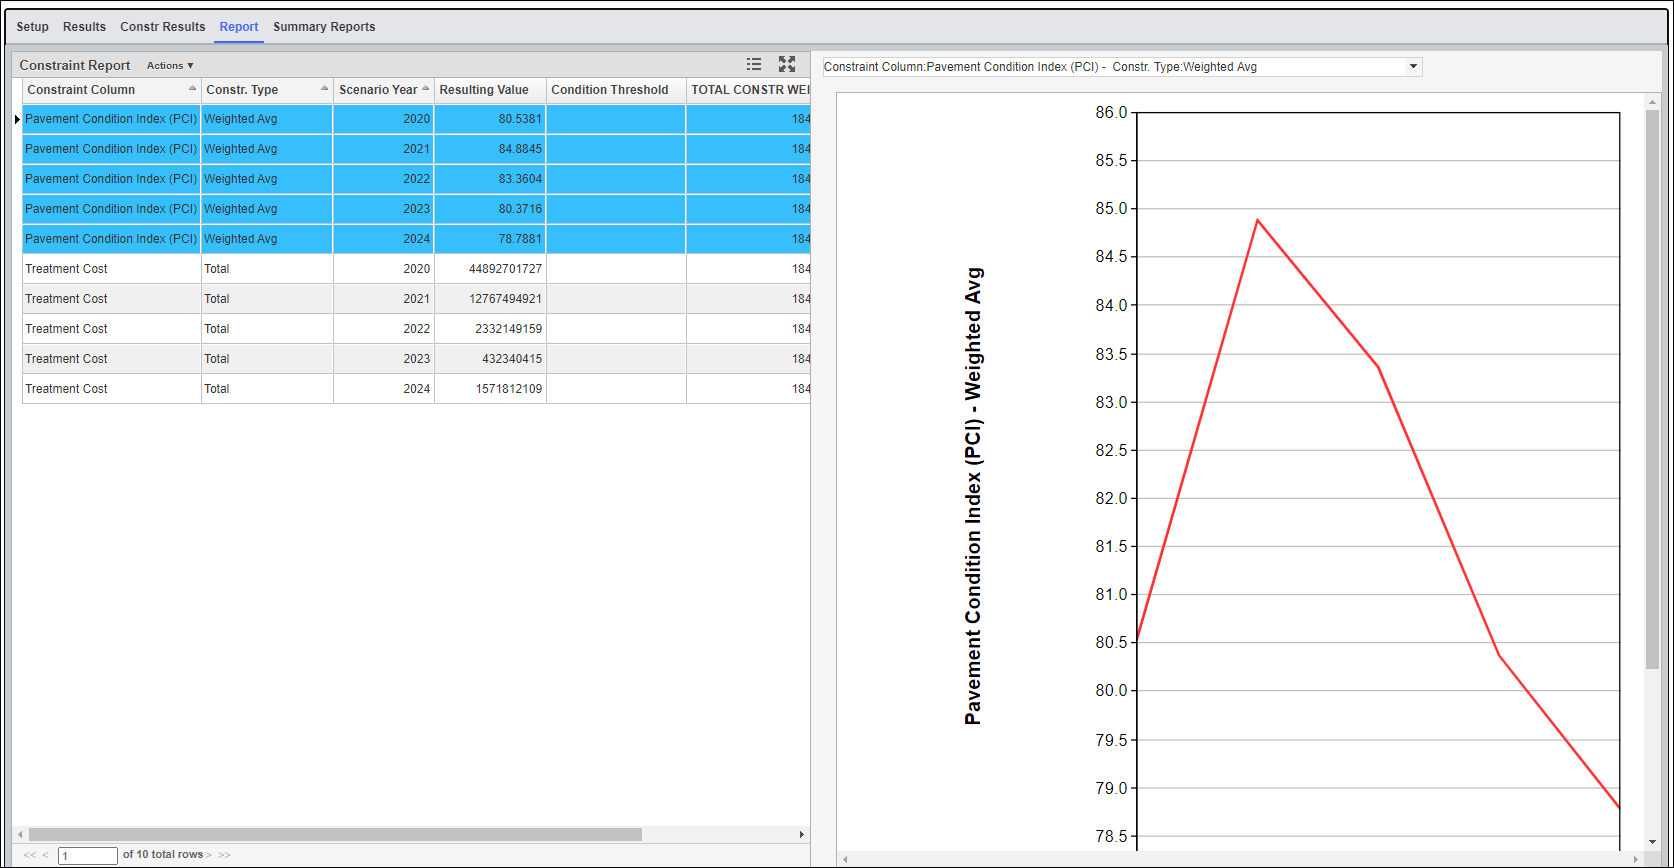
Report
The Report tab of the Optimization Analysis window shows the constraints you selected in the Reporting Functions pane of the Setup tab and the values of the constraints.
The right pane shows a graph of the values of a particular constraint (which is selected from the drop-down list field shown at the top of the pane). The Y-axis of the graph shows constraint values and the X-axis shows the number of years in the analysis. The graph is a line graph for all constraint types except Total, which is a bar graph. You may modify the appearance of the graph by using the right-click Change Graph Properties commands.
Summary Report
The Summary Report window displays the summary graphs of each analysis scenario. These graphs are defined in the Setup Graphs for Summary Report window and are the same across all analysis scenarios. The x-axis of each graph is the scenario year, whereas y-axis is defined by an SQL expression. Multiple series can be defined for each graph for comparison purpose among different series. For example, a Length by Condition State summary report will display the lane-miles of each condition state for each year, where the scenario year is displayed as the x-axis, the total lane-miles is displayed as the y-axis, and Condition State is displayed as different Series. All these parameters can be configured Setup Graphs for Summary Report window.
The left top pane shows each type of summary report, the left bottom pane shows the summary data by each series and scenario year, and the right pane displays the summary graph. You may modify the appearance of the graph by using the right-click Change Graph Properties command.
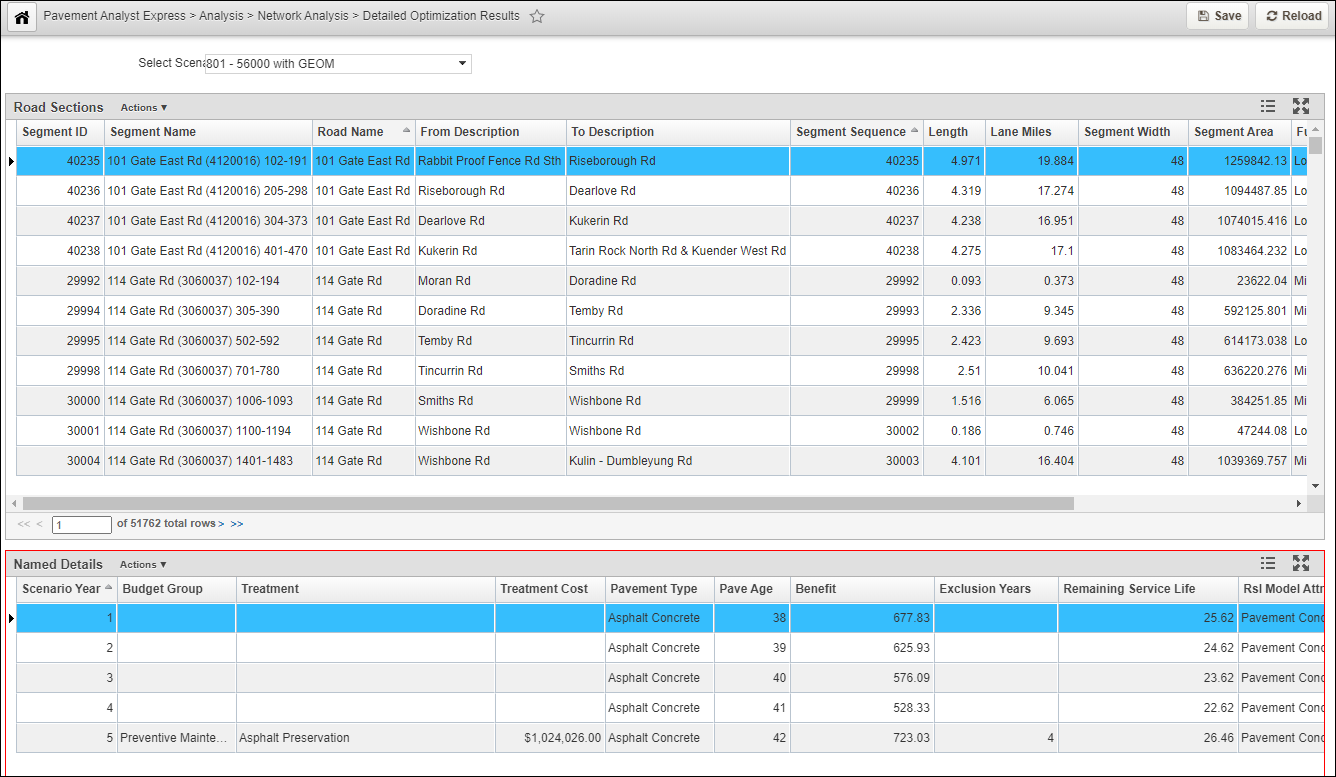
Detailed Results
For all analysis scenarios that have Save Details checked in the Setup tab, the Detailed Optimization Results window provides an in-depth look at the data resulting from the optimization. The user can select a desired scenario from the drop-down list in the Select Scenario field at the top of the window, and then the system displays the details data from the scenario. The Detailed Optimization Results window can be navigated to by following the steps below:
- Click Analysis in the top banner menu
- Click Network Analysis in the drop-down menu
- Click Detailed Optimization Results
The upper Road Sections pane shows the Network Master sections as defined in the Analysis Scope of the analysis. For the road section selected in the upper pane, the bottom Named Details pane shows each year's results for the road section.