- Open Diagnosis Period Setup window Safety Analyst > Setup > Diagnosis > Diagnosis Period.
- Make sure the stipulated diagnosis period is present in the screen. If required add a new diagnosis period and adjust the Start Date and End Date and Save the record.
Note: By default diagnosis group column (Safety Analyst > Setup > Diagnosis > Diagnosis Group ) and comparison group (Safety Analyst > Setup > Diagnosis > Diagnosis Comparison Group) windows are editable only by the system admin. It is NOT recommended to edit anything in these two windows. The default diagnosis groups are: By Class, and By County.
- Open diagnosis norm setup window: Safety Analyst > Setup > Diagnosis > Diagnosis Norm.
- Right Click and Insert a New Record.
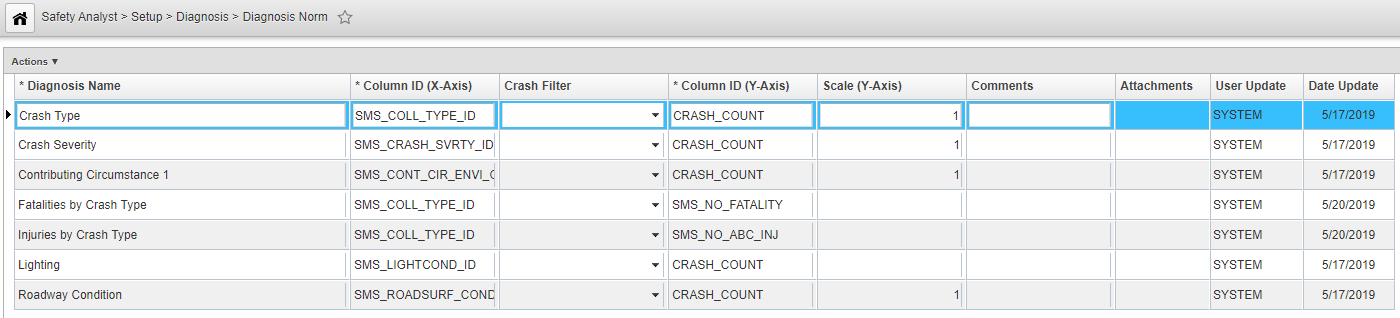
3.Add a Diagnosis Name.
For Column ID (X-Axis) Column a Categorical Variable (T-list Type) from Crash Data table (SMS_CRASH_DATA) needs to be included.
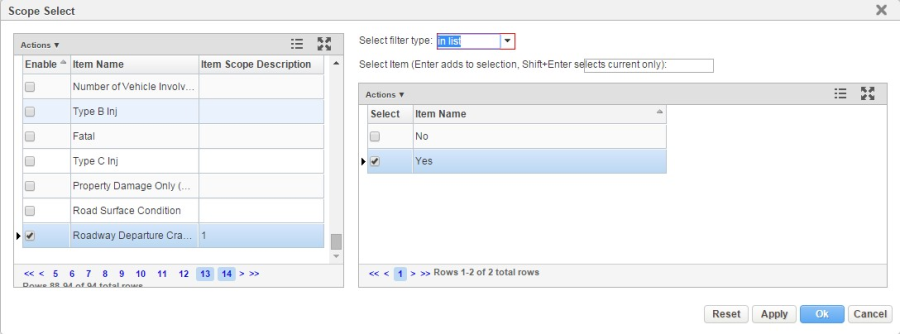
- Choose a crash filter for the categorical variable. The crash filter will be applied the Crash Data table to restrict crash counts only limited to the crash filter. For example, in order to view roadway departure crashes the following Column ID (X-Axis) and Crash Filter needs to select:
- X-Axis as SMS_CF_ROADWAY_DEPT for Column ID (X-Axis) and
- Crash Filter (In Safety > Network Screening > Setup > Crash Filter window): e.g. Roadway Departure Crashes (Yes).
- Add Column ID (Y-Axis). The default Column ID is SMS_TOTAL_CRASH_COUNT.
- Add a scale Factor. The recommended value is 1 for SMS_TOTAL_CRASH_COUNT. If crash rate is used a different factor can be used. Scale Factor is the multiplier applied to the Y-Axis to provide a presentable value for Y-Axis.