To navigate the Reports window, follow the steps below:
- Click on the Structure Analyst application.
- Select GIS & Reports from the top banner.
- Click Reports in the drop-down menu.
Standard Reports without Filter
The following reports are configured using the results from the Short Term Analysis scenario and can be shown directly without first setting up a filter:
- BMS: Current Recommendations
- BMS: Maintenance Candidates Bridge 5 To 7
- BMS: Maintenance Candidates Deck Replacement
- BMS: Maintenance Candidates General Rehab
- BMS: Maintenance Candidates General Repairs
- BMS: Maintenance Candidates Painting
To display an existing standard report without filter, follow the steps below:
- In the left pane of the Reports page, locate the report you wish to view.
- Right-click on that report.
- Click Show Report in the function menu.
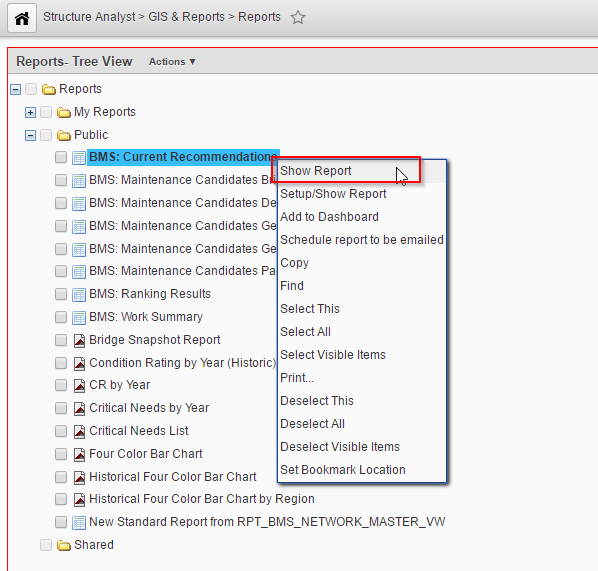
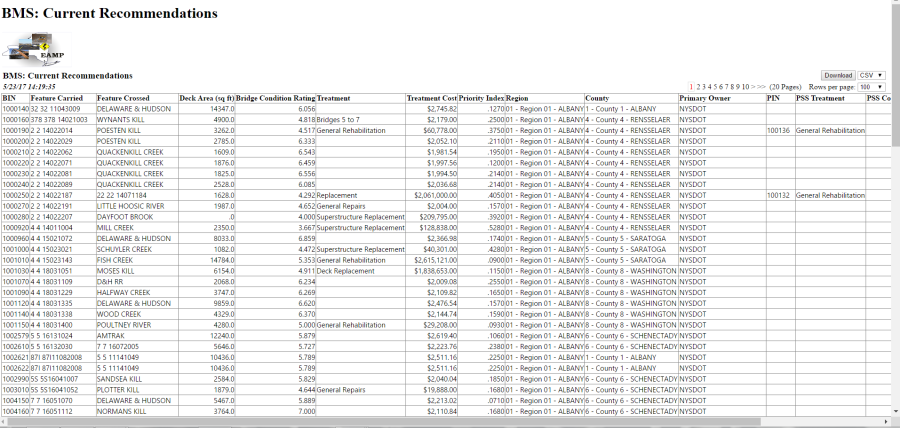
- This opens a new browser window or tab which displays the selected report using the most recent data from the database. An example of a standard report is shown below:
Standard Report with Filter
The following reports are configured to show the results of a particular analysis scenario. They need to be filtered by Scenario to generate.
- BMS: Ranking Results
- BMS: Work Summary
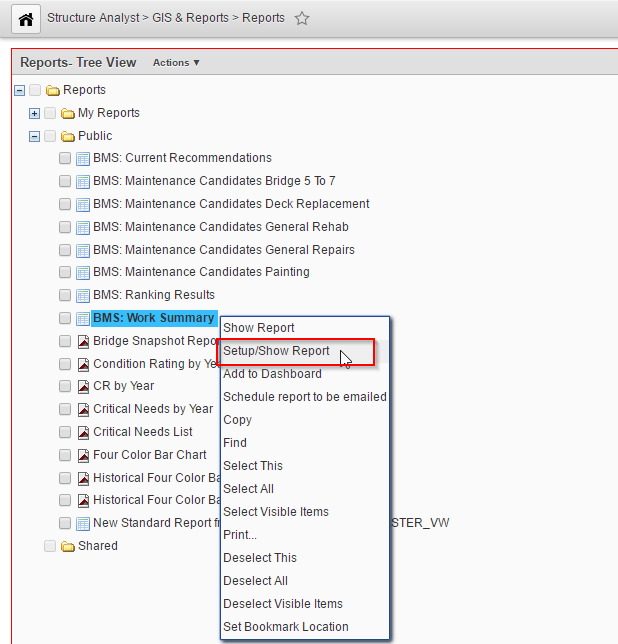
To display an existing standard report with filter, follow the steps below:
- In the left pane, of the Reports page, locate the report you wish to view.
- Right-click on that report.
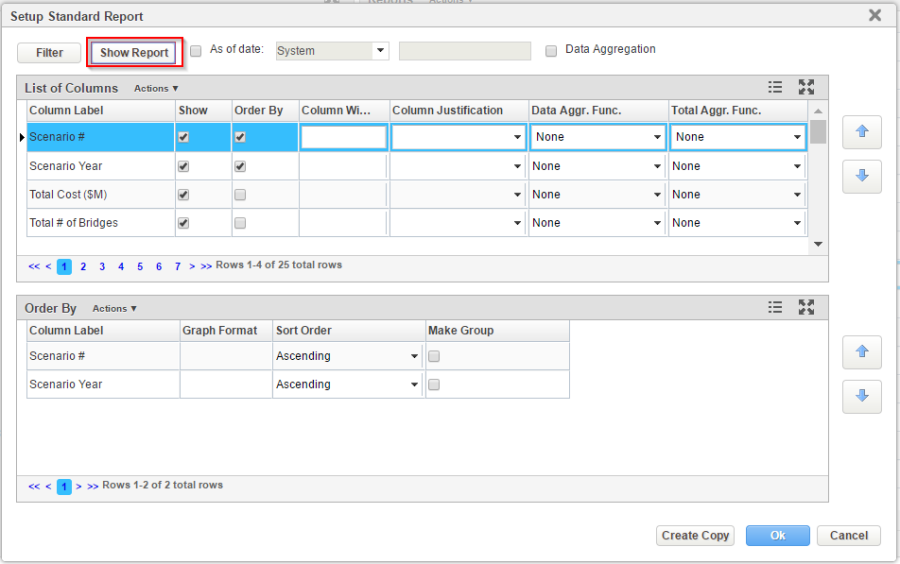
- Click Setup/Show Report in the function menu.
- Click Filter in the Setup Standard Report window.
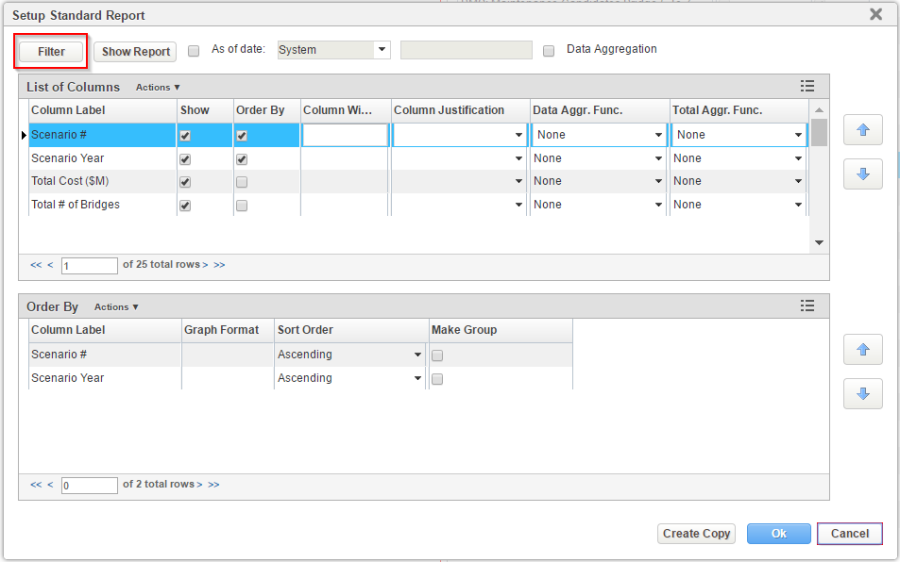
- In the pop-up window, check Enable for Scenario #. Select in list from the Select filter type drop down.
- Check the desired scenario in the right pane
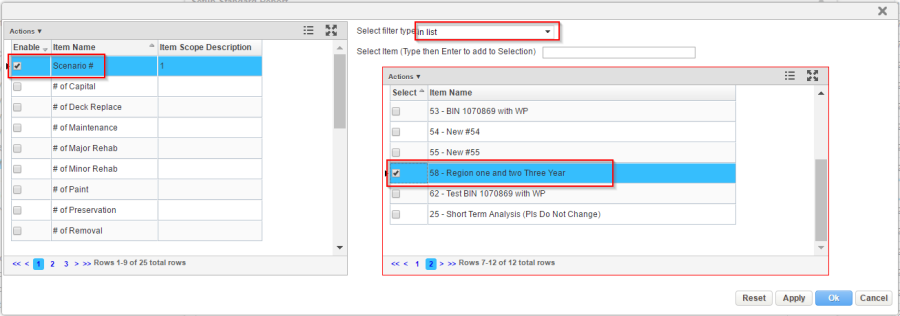
- Click OK.
- Click Show Report.
Jasper Report
The following Jasper reports are configured.
- Bridge Snapshot Report
- Condition Rating by Year (Historic)
- CR by Year
- Critical Needs by Year
- Critical Needs List
- Four Color Bar Chart
- Historical Four Color Bar Chart
- Historical Four Color Bar Chart by Region
To display an existing Jasper report, you should first decide what output format you would like. Jasper reports may be displayed in a Microsoft Excel spreadsheet, an Adobe PDF document, or an HTML document.
When you have decided upon the output format, follow the steps below:
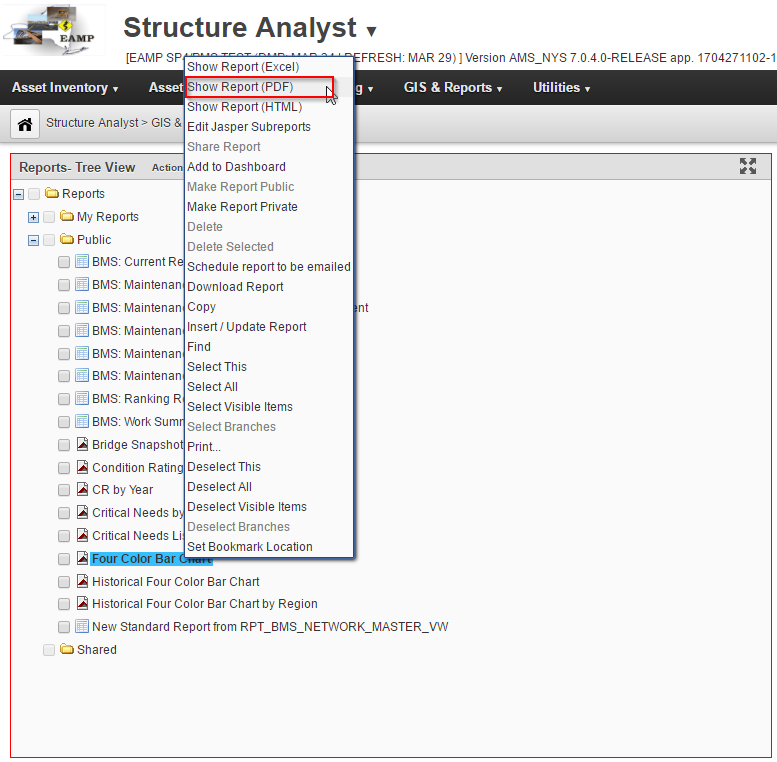
- In the left pane, of the Reports page, locate the report you wish to view.
- Right-click on that report.
- Click the show report command corresponding to the desired output in the function menu, e.g. Show Report (PDF).
- If the Jasper report requires input data, the system will display a dialog box so you may enter the necessary values.
- Click OK.
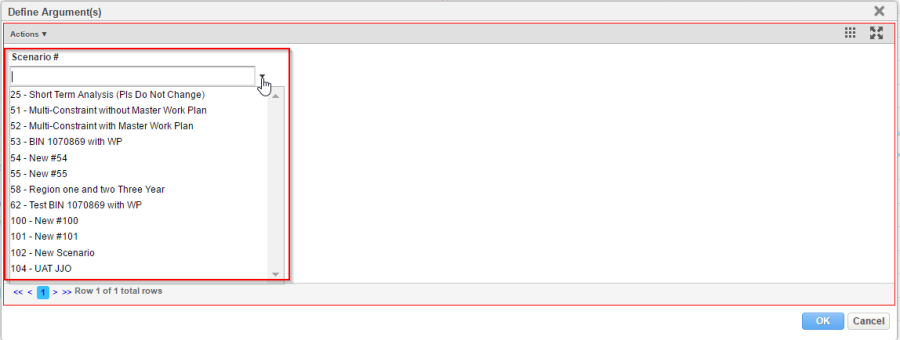
- A report will be generated based on your selection.