1.1 General Scenario Setup - Click Here to Structure Optimization Analysis Exercise
The objective of this lesson is for the participant to understand how to create and run a multi-constraint optimization network analysis. At the end of this lesson, the user should know how to setup and run a multi-constraint optimization network analysis. |
|---|
In this example, we create and run a multi-constraint optimization network analysis by Perform the following steps:
1. Open the Optimization Analysis window: Structures Analyst > Analyst > Network Analysis > Optimization Analysis.
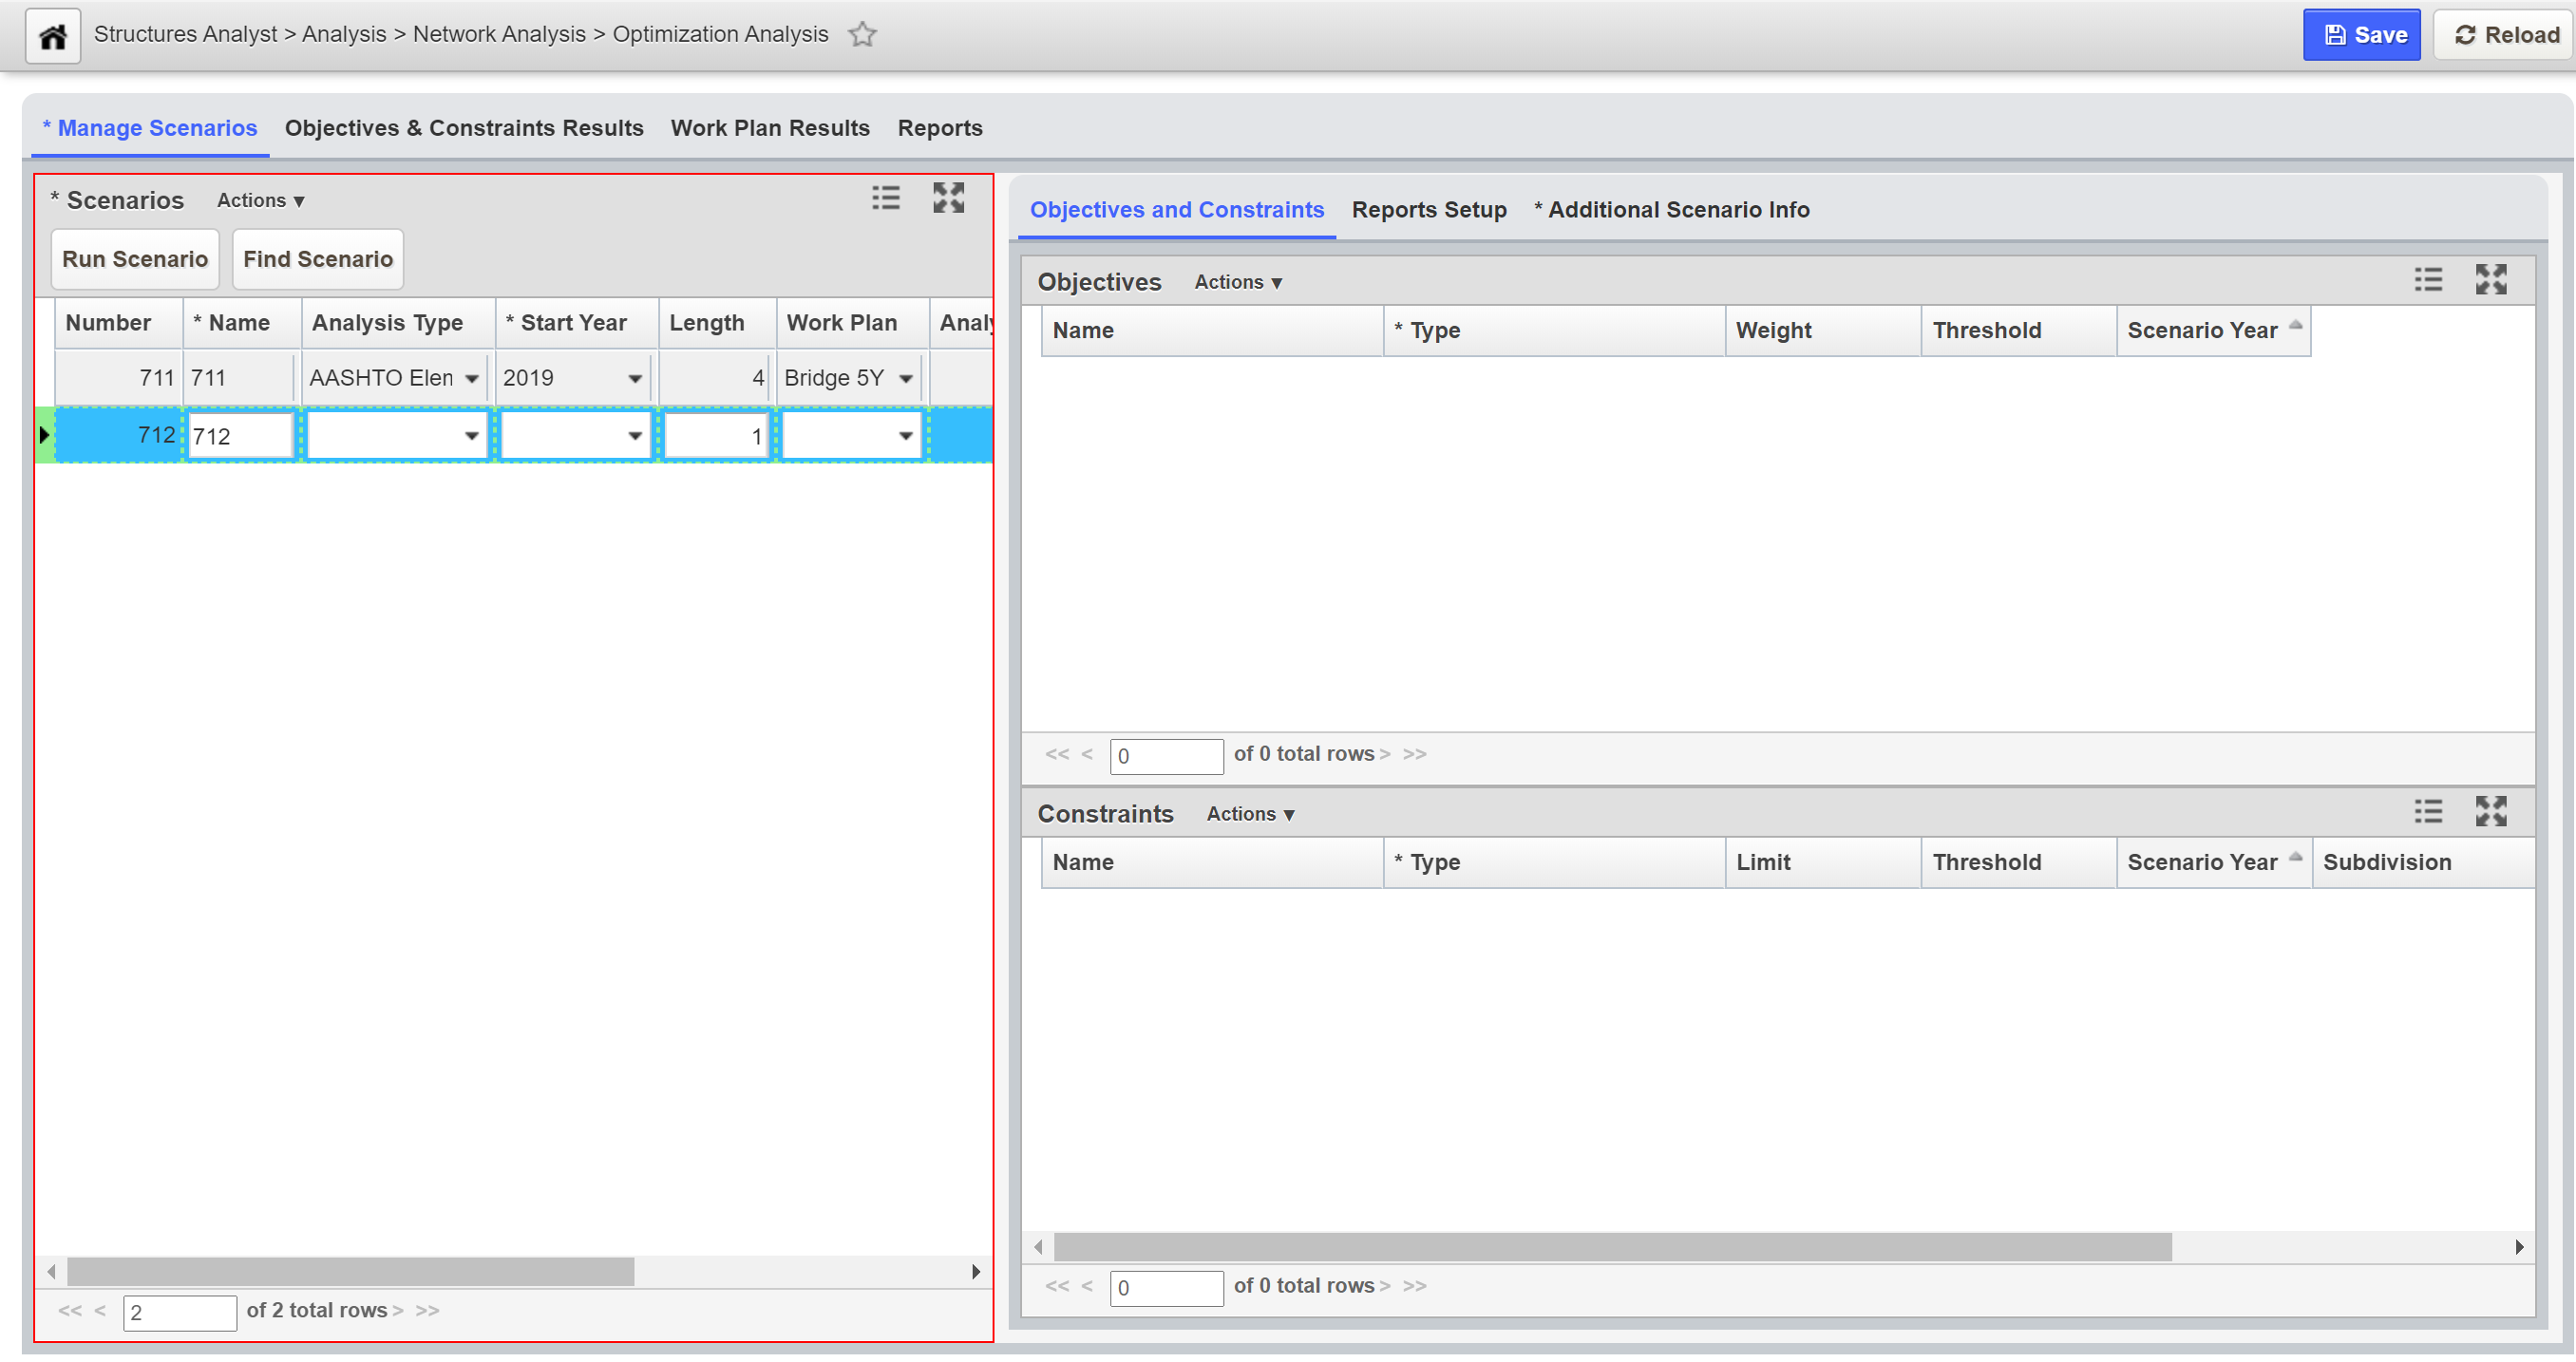
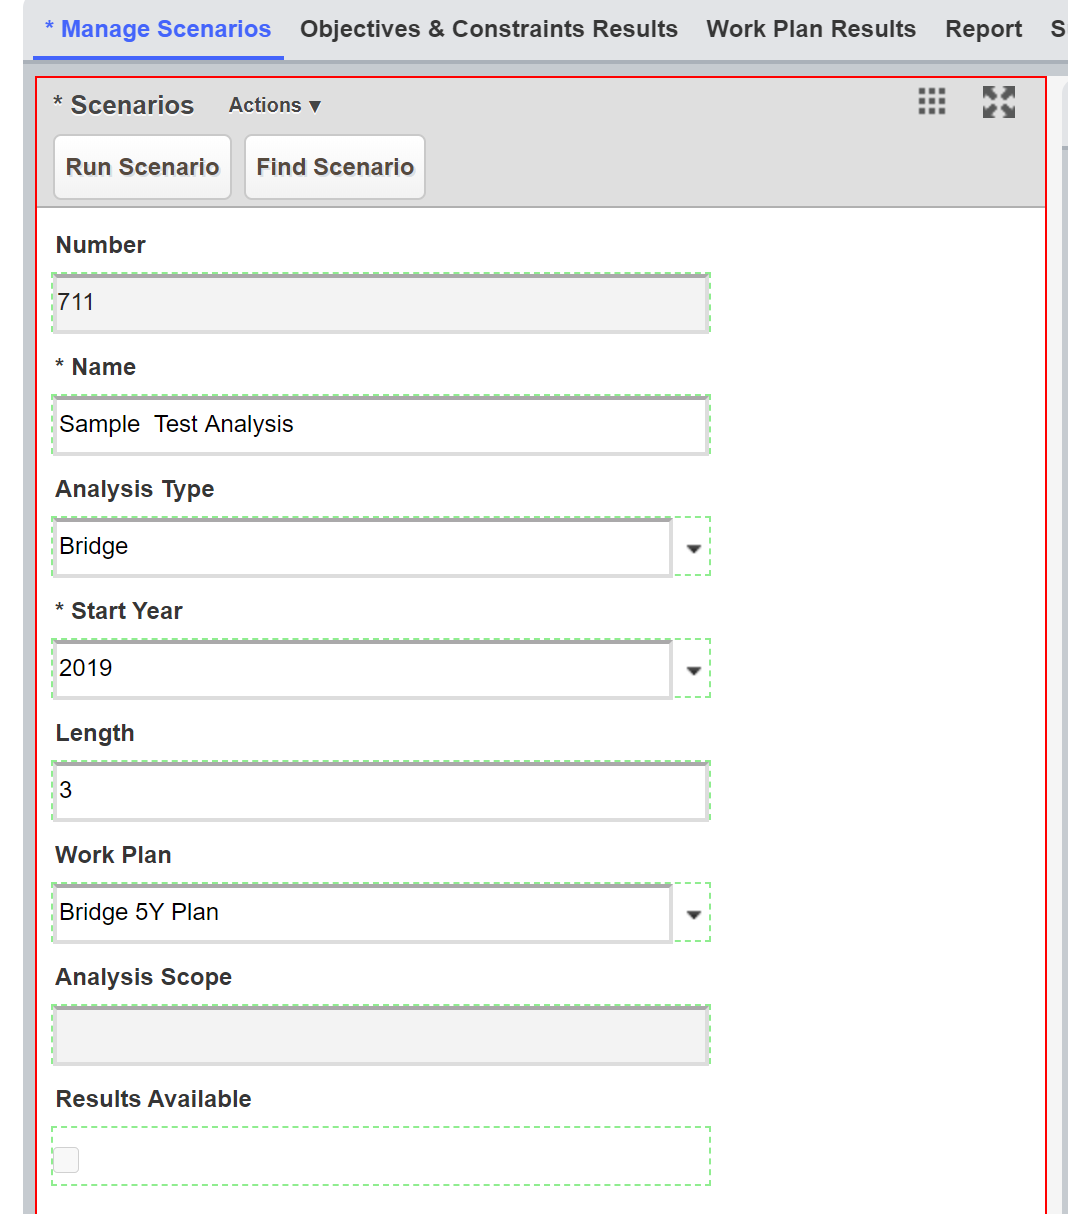
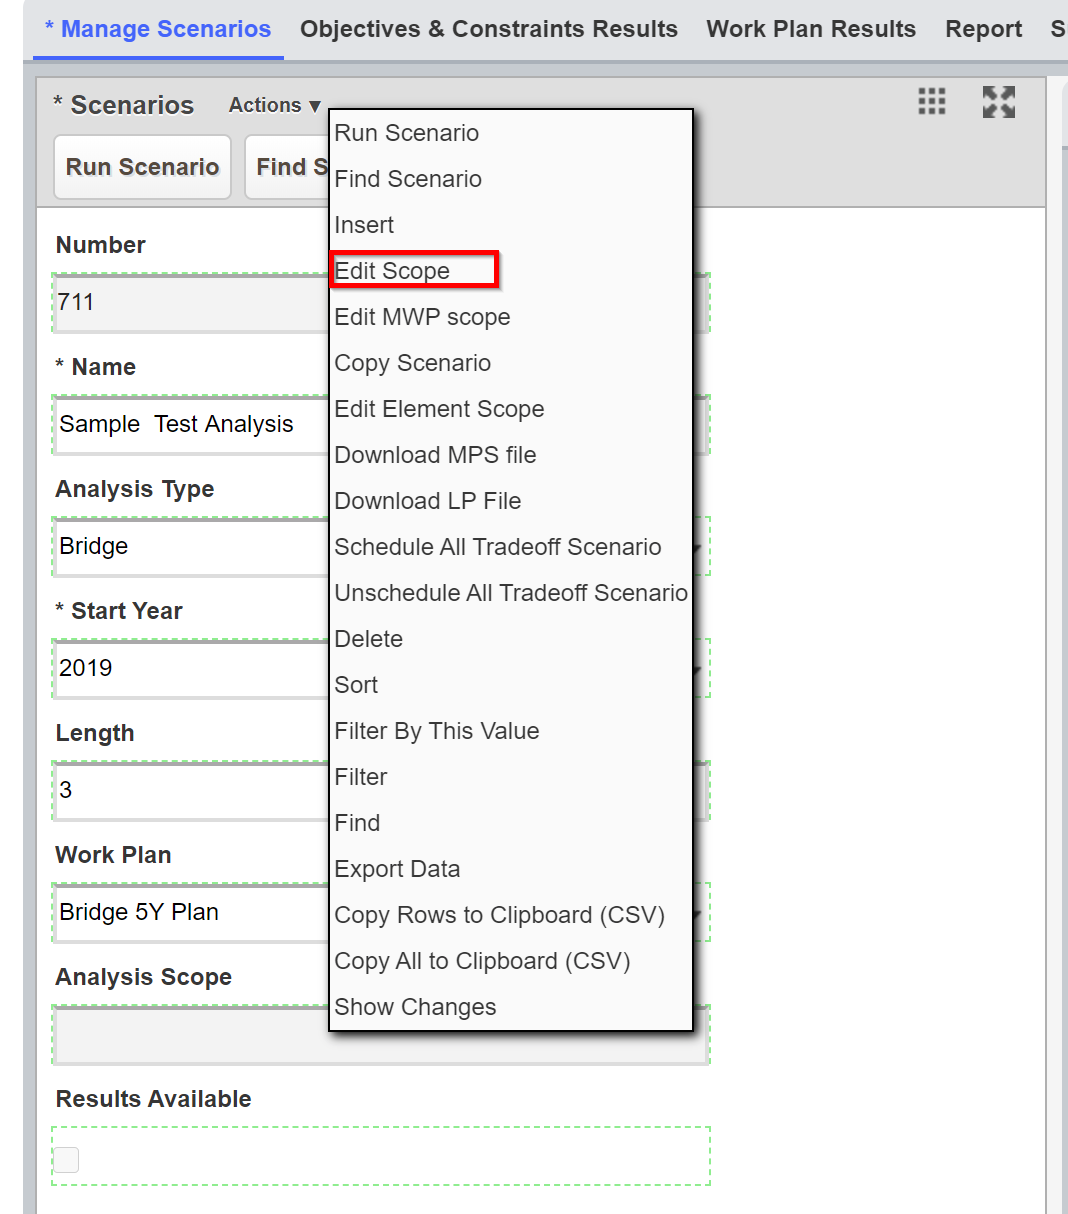
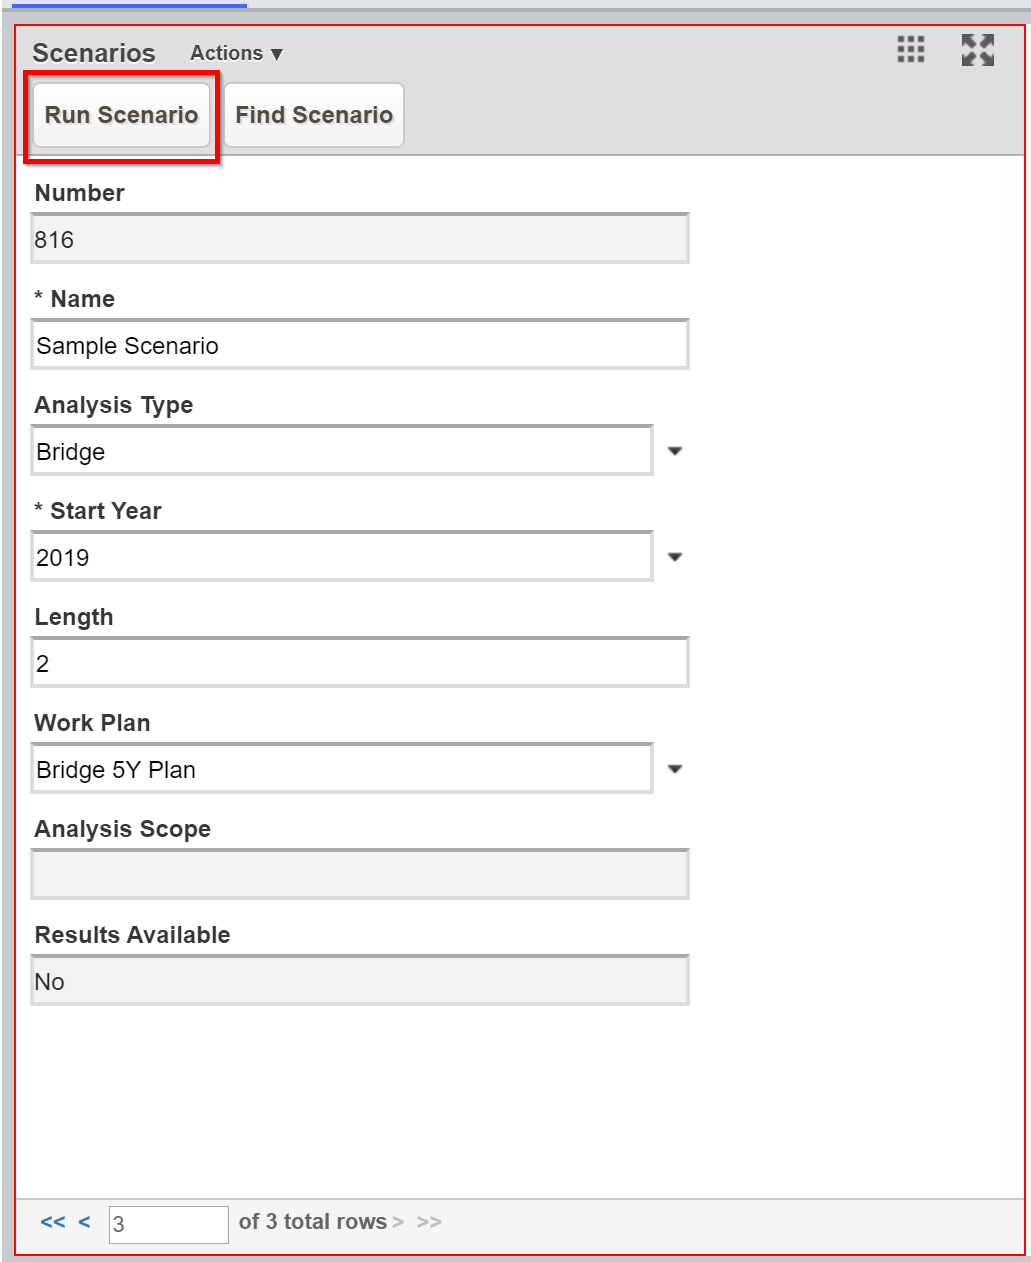
2. Right-click in the Scenarios pane and then click Insert The system creates a new scenario. An example of the Scenarios pane is shown below.
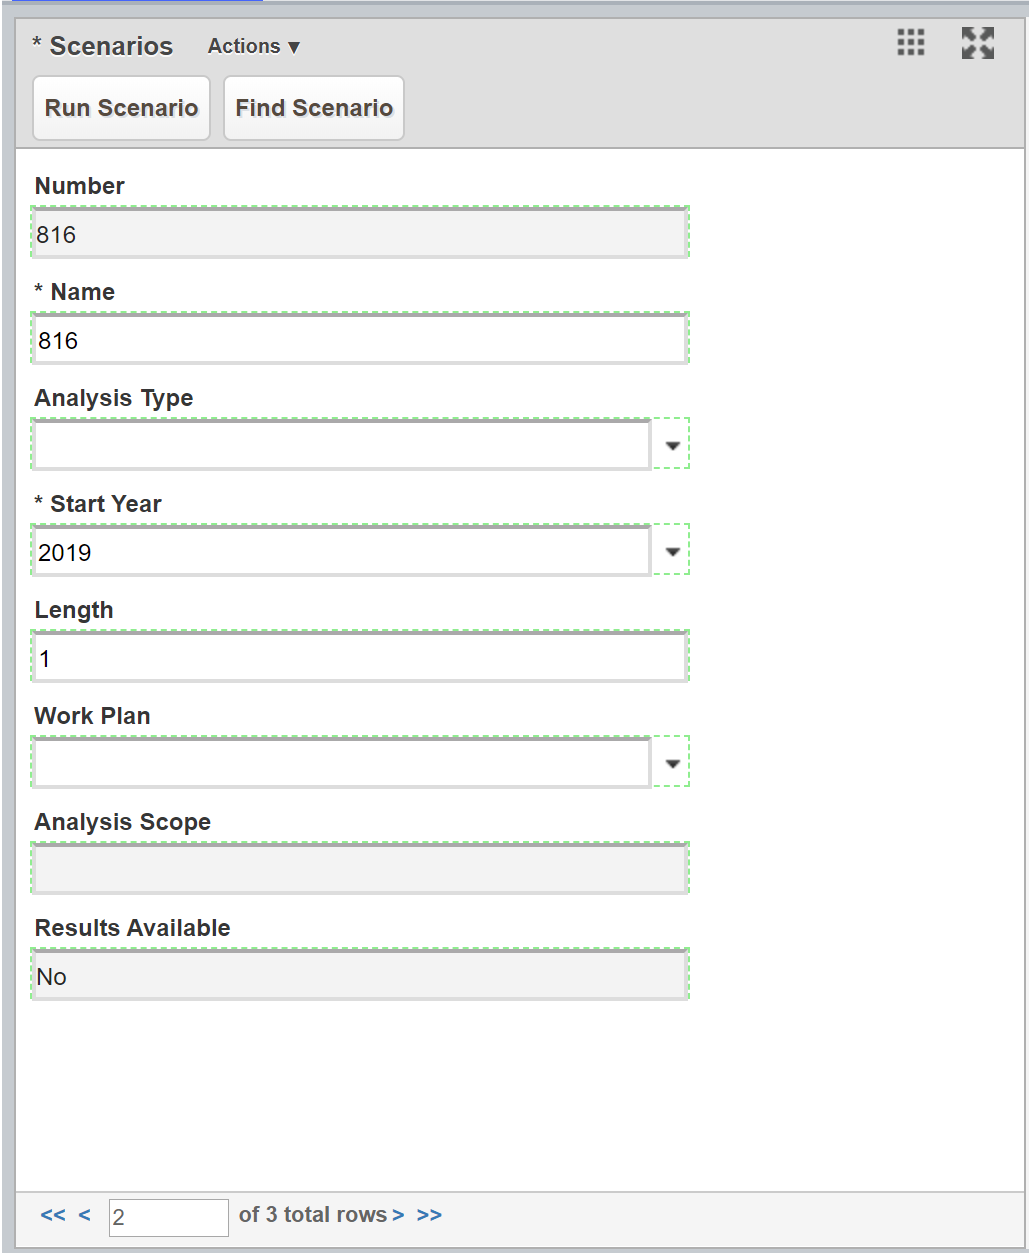
3. Highlight the text in the Name field and then type the name for the optimization.
4. Click the Analysis Type drop-down and select the right type.
5. Click the Start Year drop-down and select the year of interest.
6. Click in the Analysis Length field and then type the number of years covered by this analysis
7. Click the Work Plan drop-down and select the right work plan.
Note:
At this point, by default, all structures for which your administrative unit is responsible will be included in the analysis. However, if you wish to use a smaller set of structures in the analysis, then perform steps 8 - 12
8. Right-click in the Analysis Scope field and select Edit Scope.
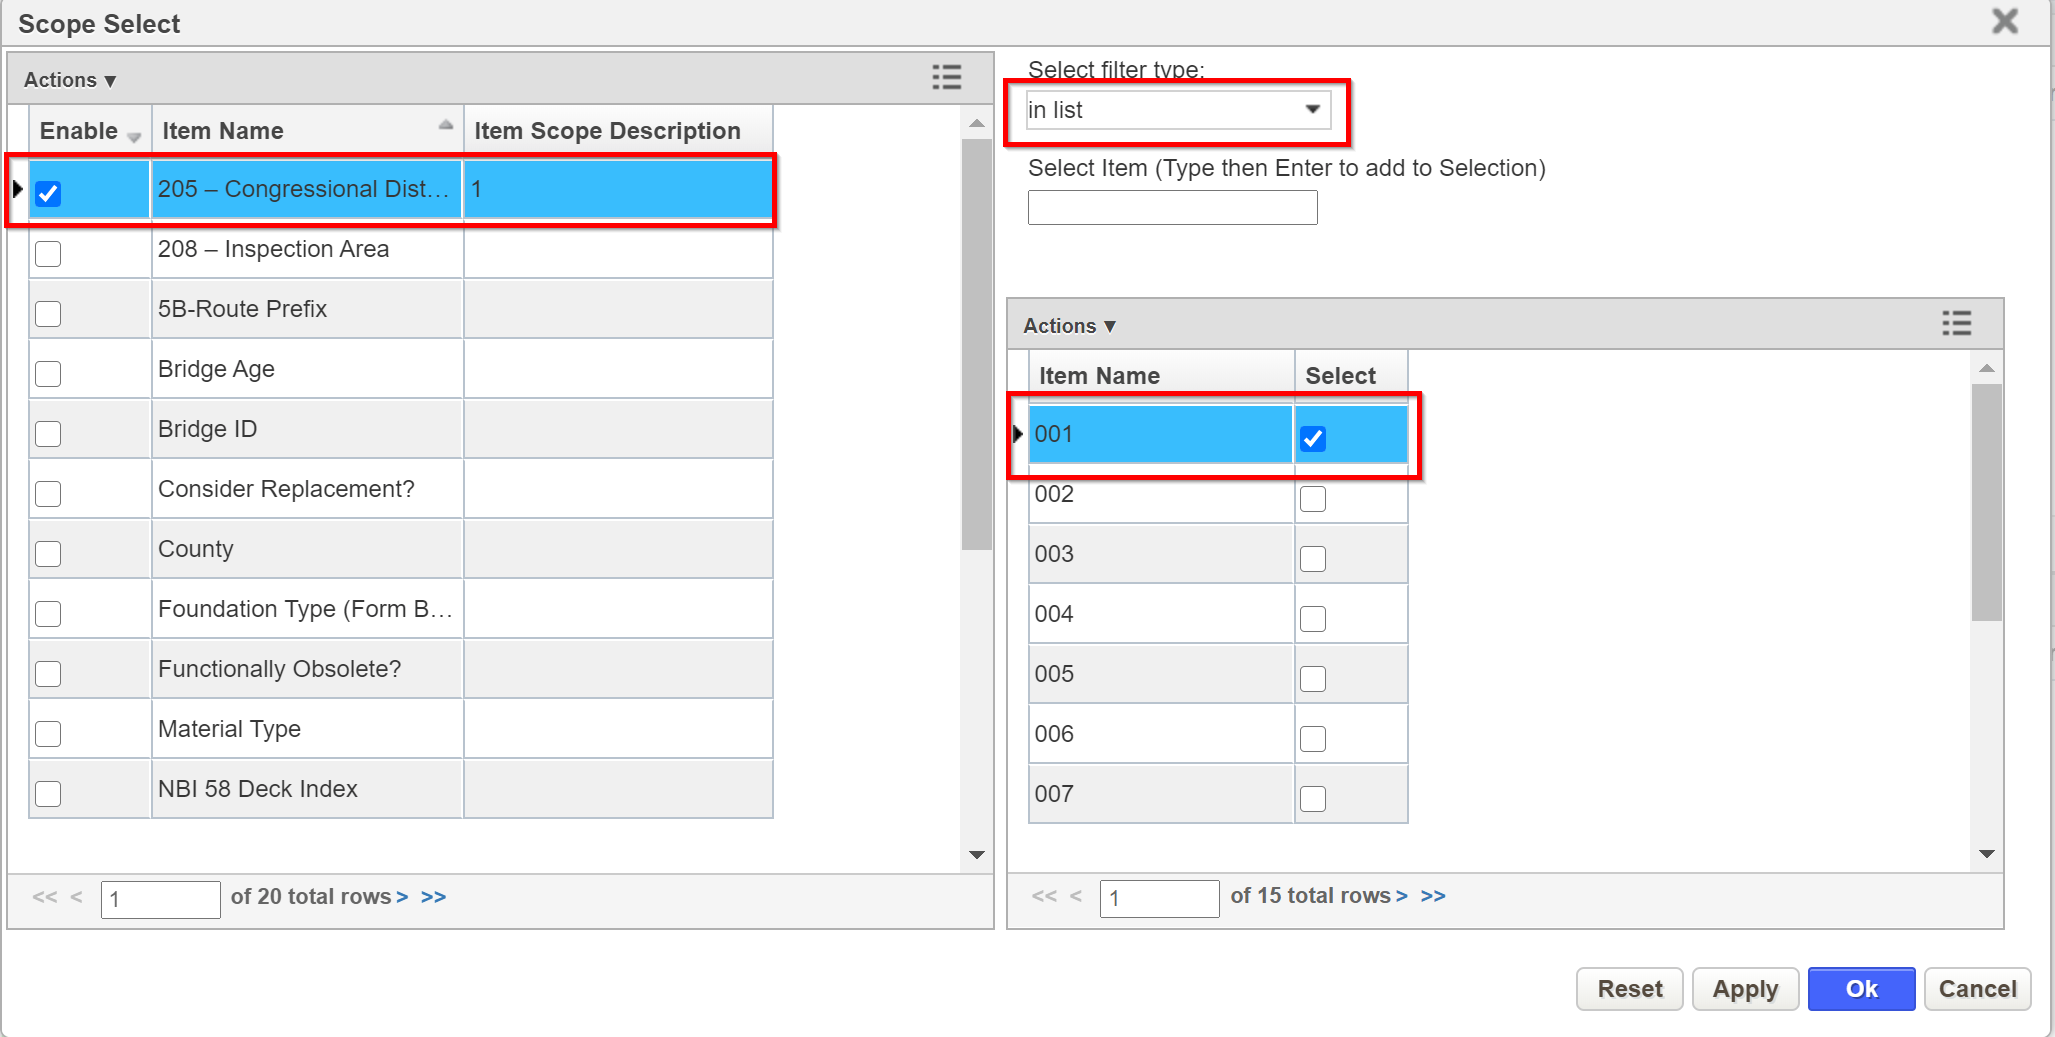
9. In the left pane of the Scoop Select pop-up window, select the column you want to use to reduce the scope of the analysis (i.e.Congressional District)
10. In the Select Filter Type field in the right pane, click the down arrow and then click the desired filter type (i.e. In List). The system displays the values of the selected column that match the filter type.
11. Select the desired values in the right pane. When you are finished selecting values, click OK
12. This closes the dialog box and shows the selected value(s) in the Analysis Scope field in the Scenarios pane.
13. Next, click on the Additional Scenario info tab in the right hand pane.
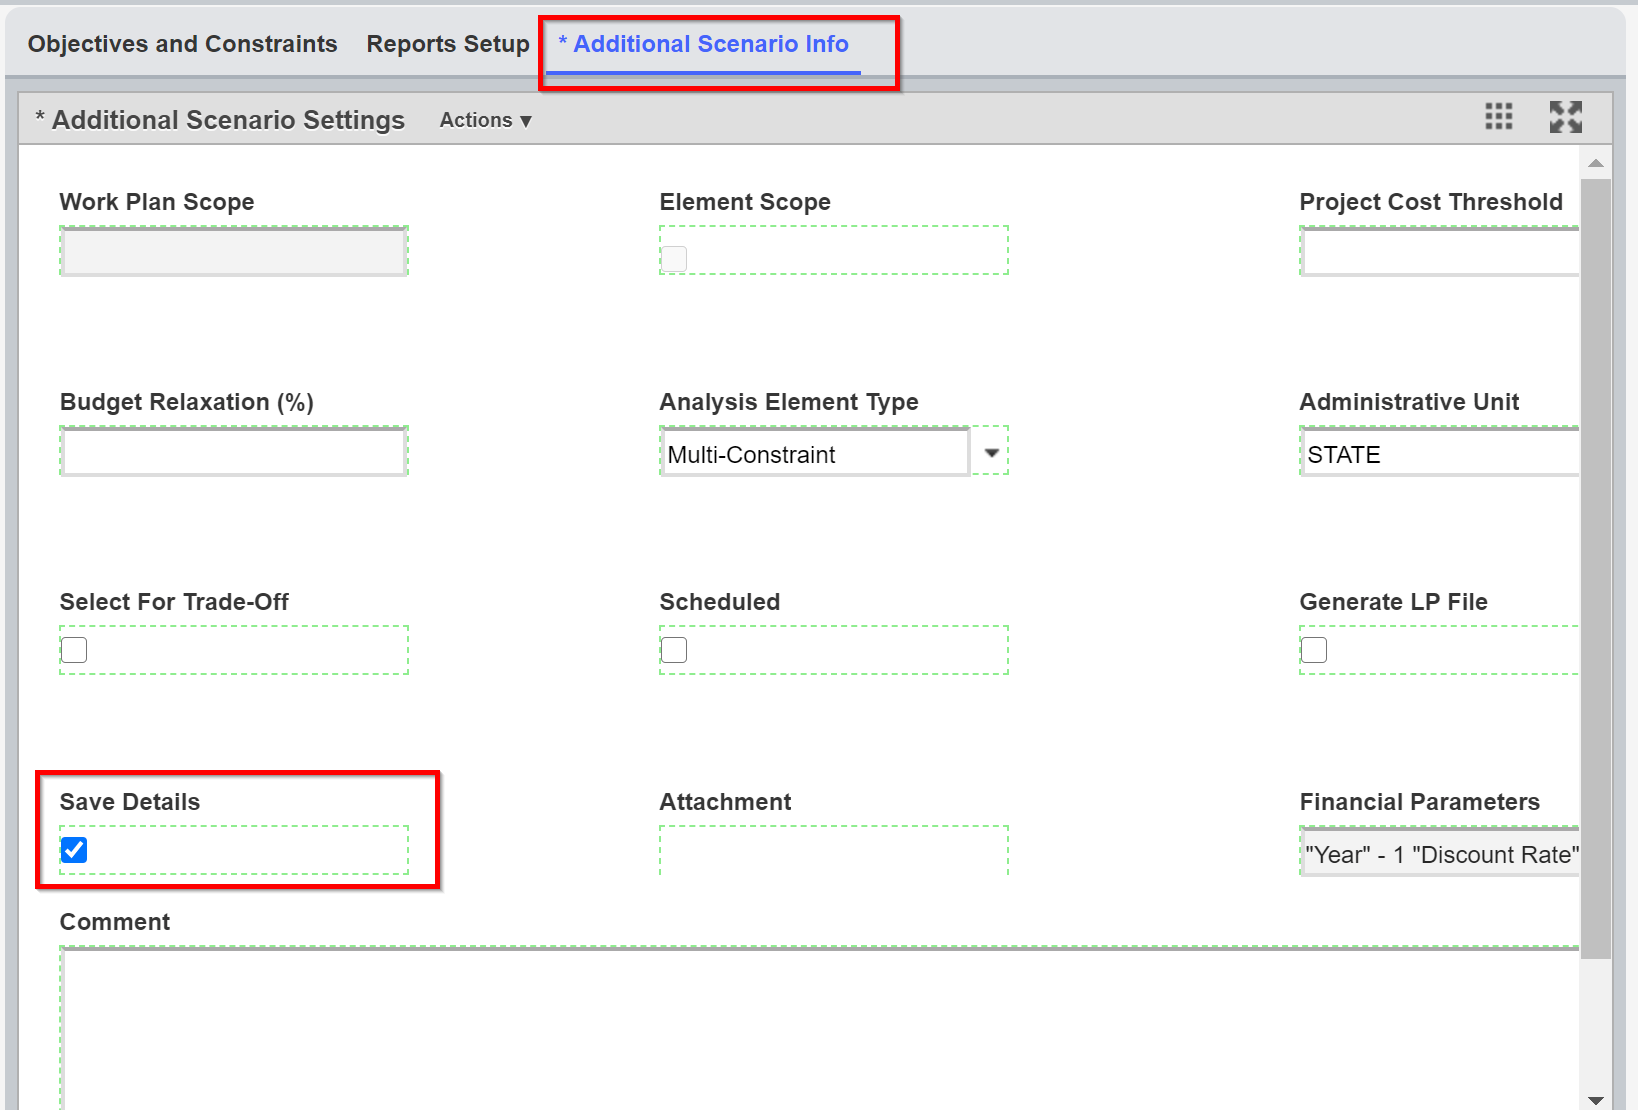
14. If you wish to save the details of the optimization for further study, click the Save Details check box. (The details may be viewed in the Detailed Optimization Results window.)
1.2 Specify Scenario Objective and Constraints
The objective of this lesson is for the participant to understand how to enter objectives and constraints in the Objectives and Constraints panes. At the end of this lesson, the user should know how to insert new objectives and constraints . |
|---|
In this example, we enter objectives and constraints by performing the following steps:
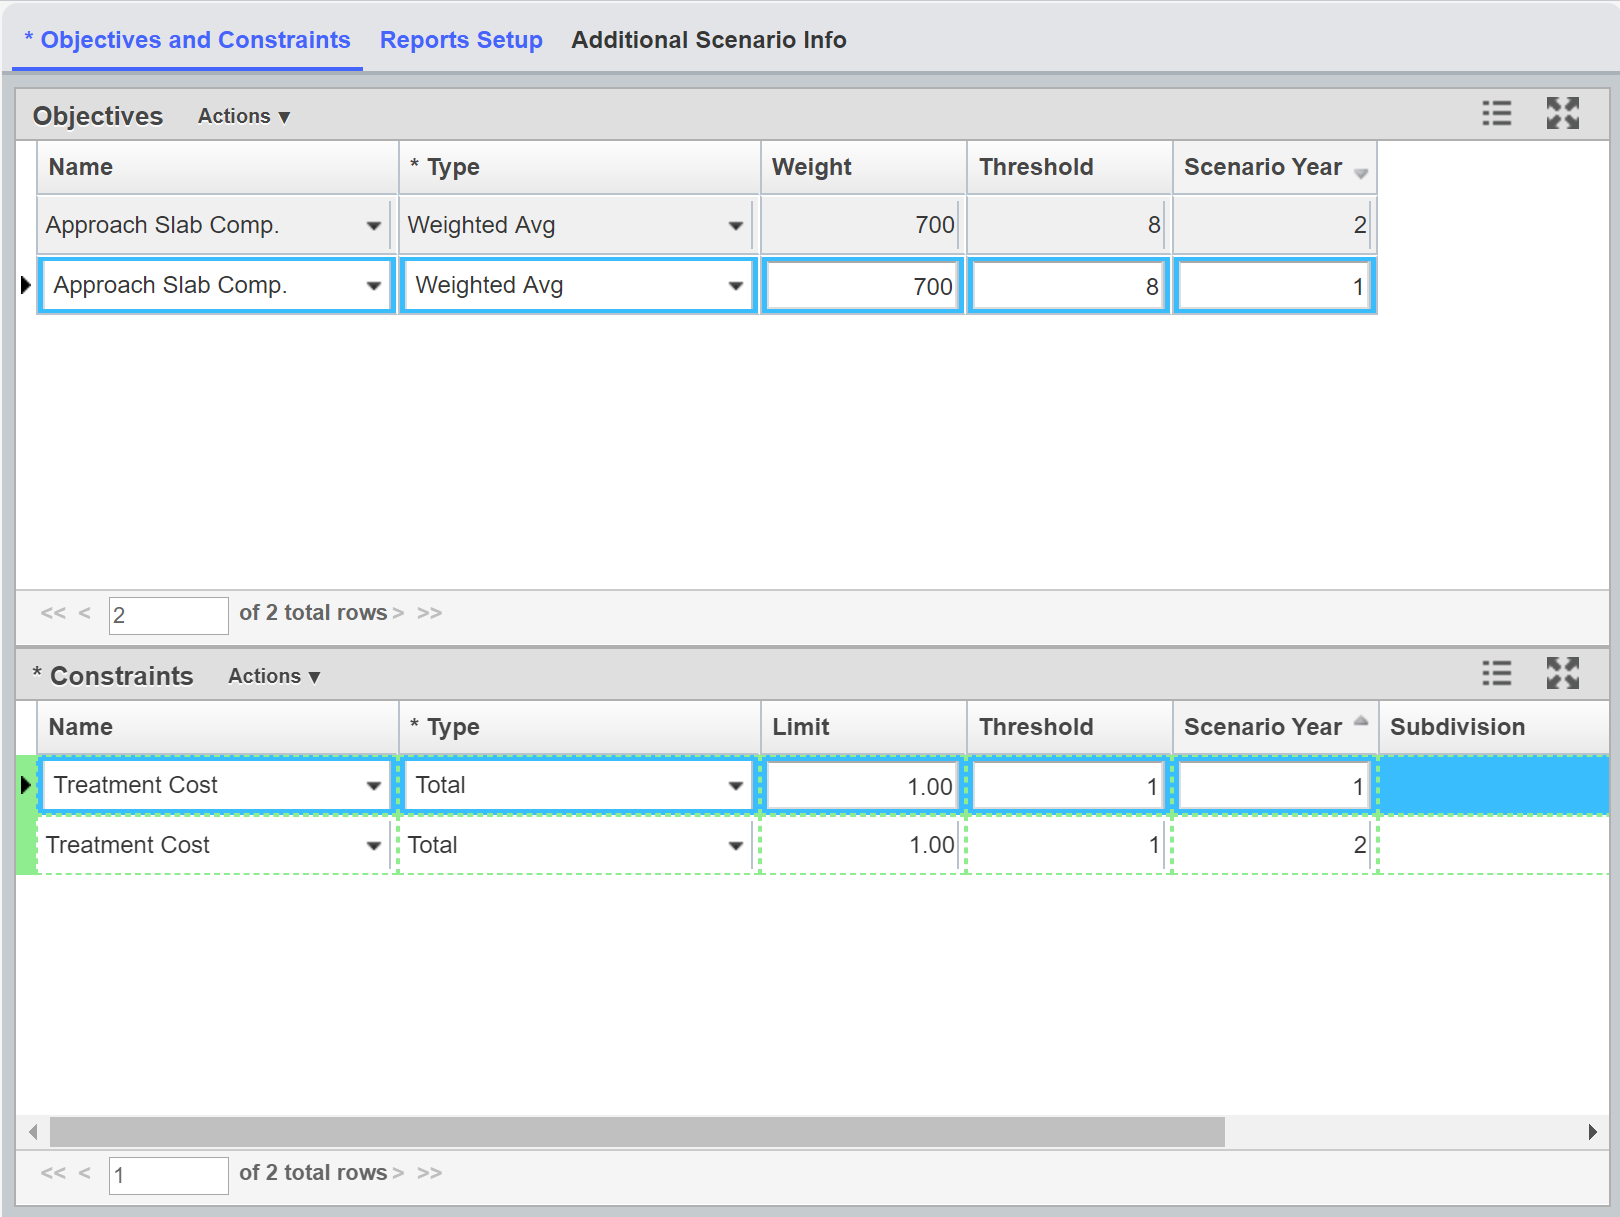
1. Click on the Objectives and Constraints tab.
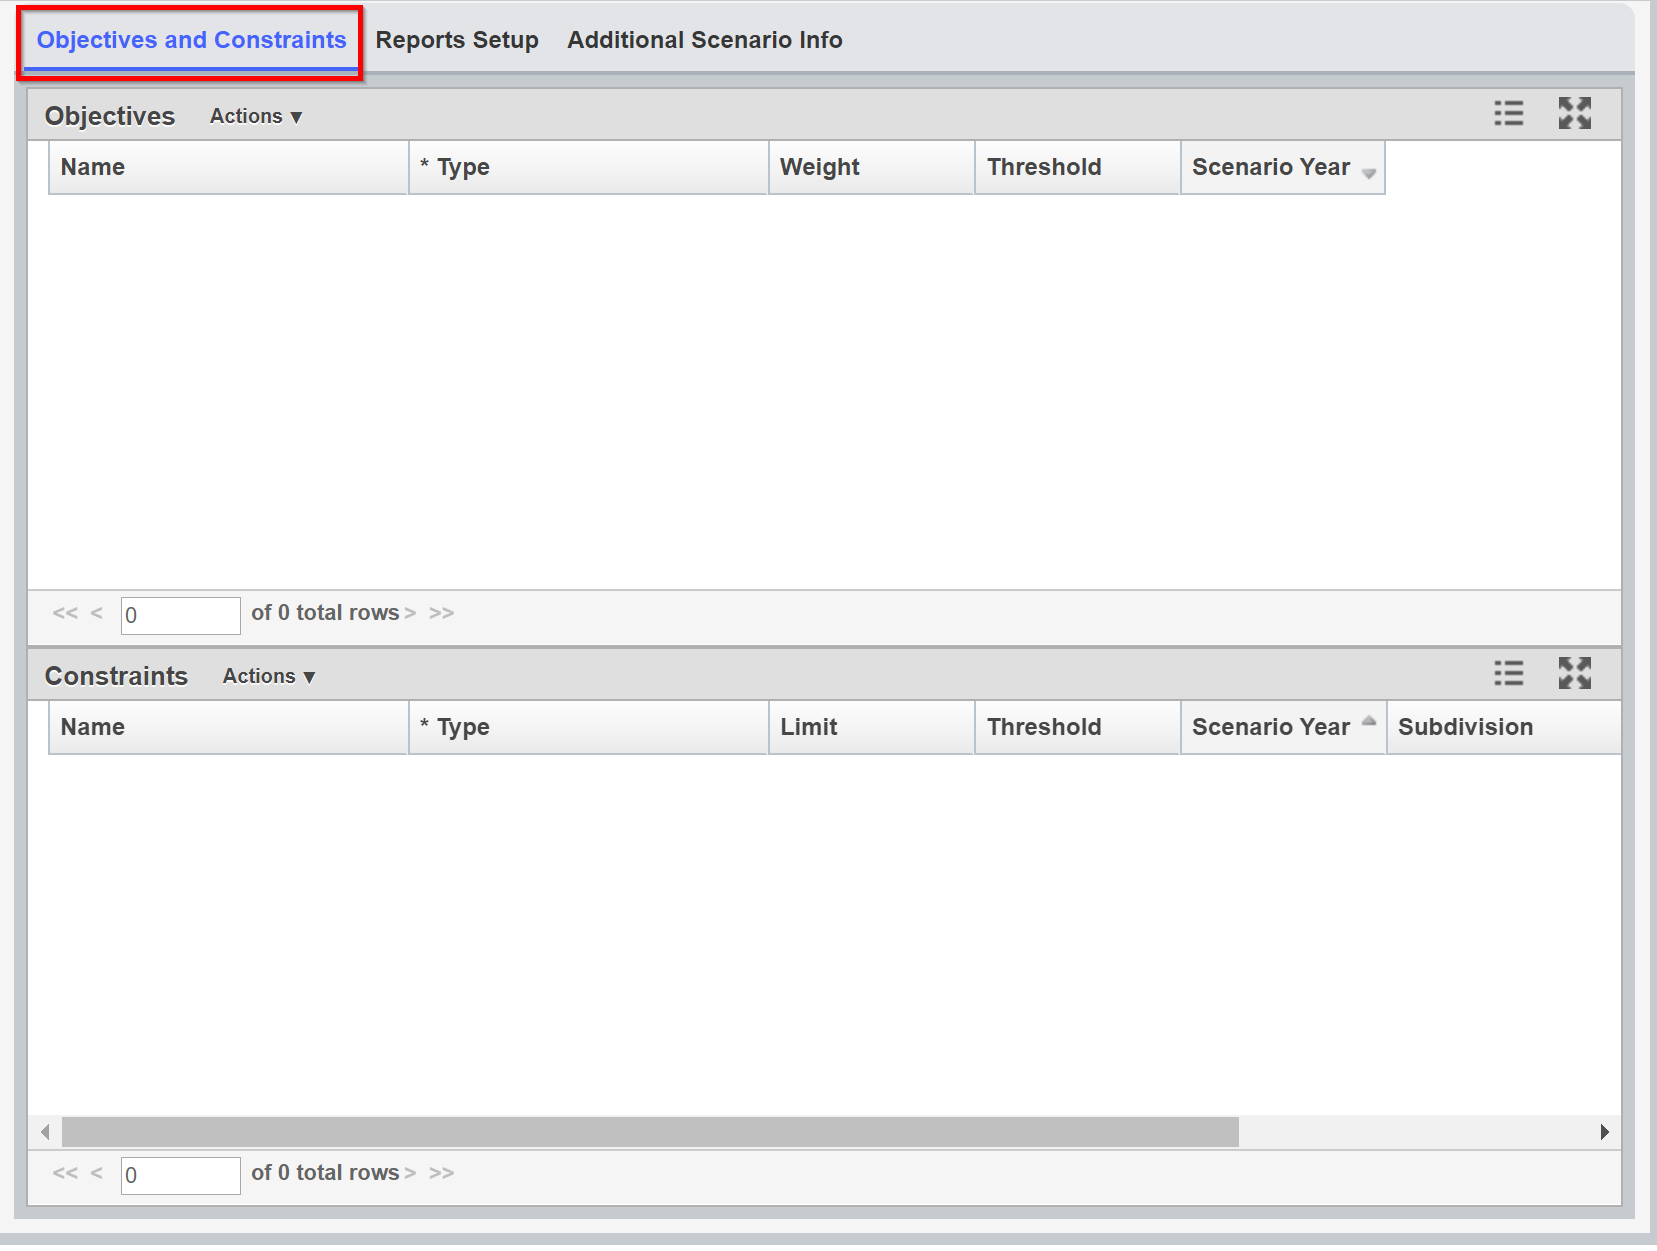
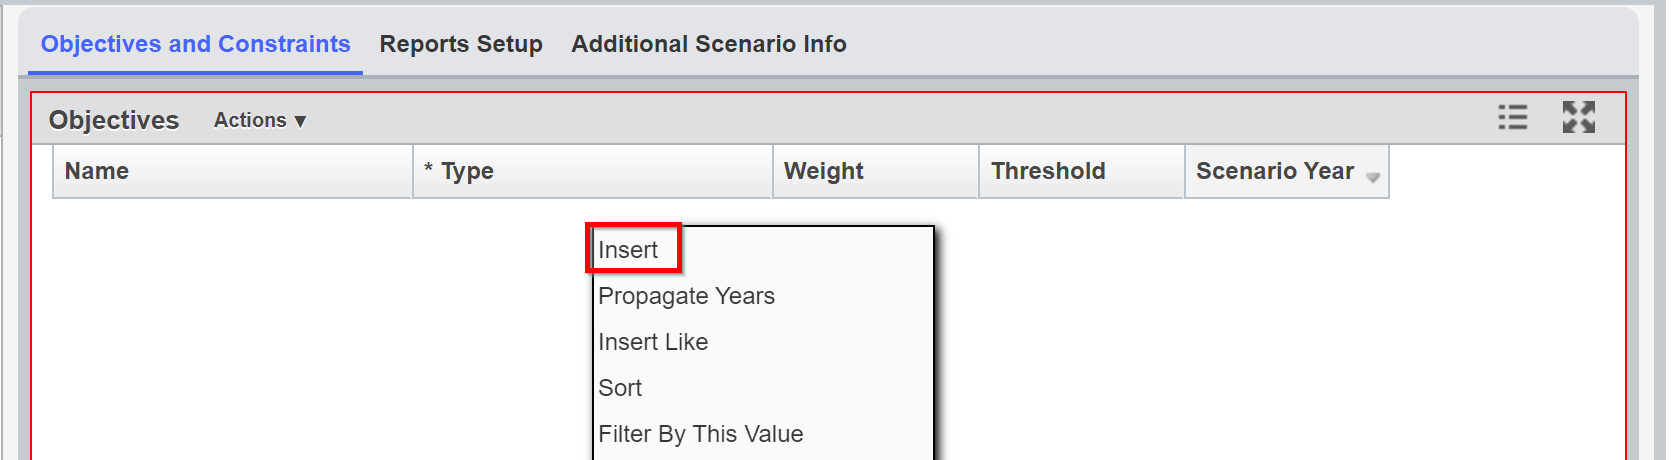
2. Right-click In the Constraints pane and select Insert. The system adds a new record to the pane.
3. Click the Name drop-down and select the desired choice.
4.Click the Type drop-down and select a type.
5. Click in the Weight field, the Threshold field, and Scenario Year field and enter the appropriate values respectively.
6. Right-click on the newly created row and select Propagate Years.
7. Next, Right-click in the Constraints pane and select Insert.
8. Click the Name drop-down and select the desired choice.
9. Click the Type drop-down and select a type.
10. Click in the Limit field, the Threshold field, and Scenario Year field and enter the appropriate values respectively.
11. Right-click on the newly created row (in the constraints pane) and select Propagate Years.
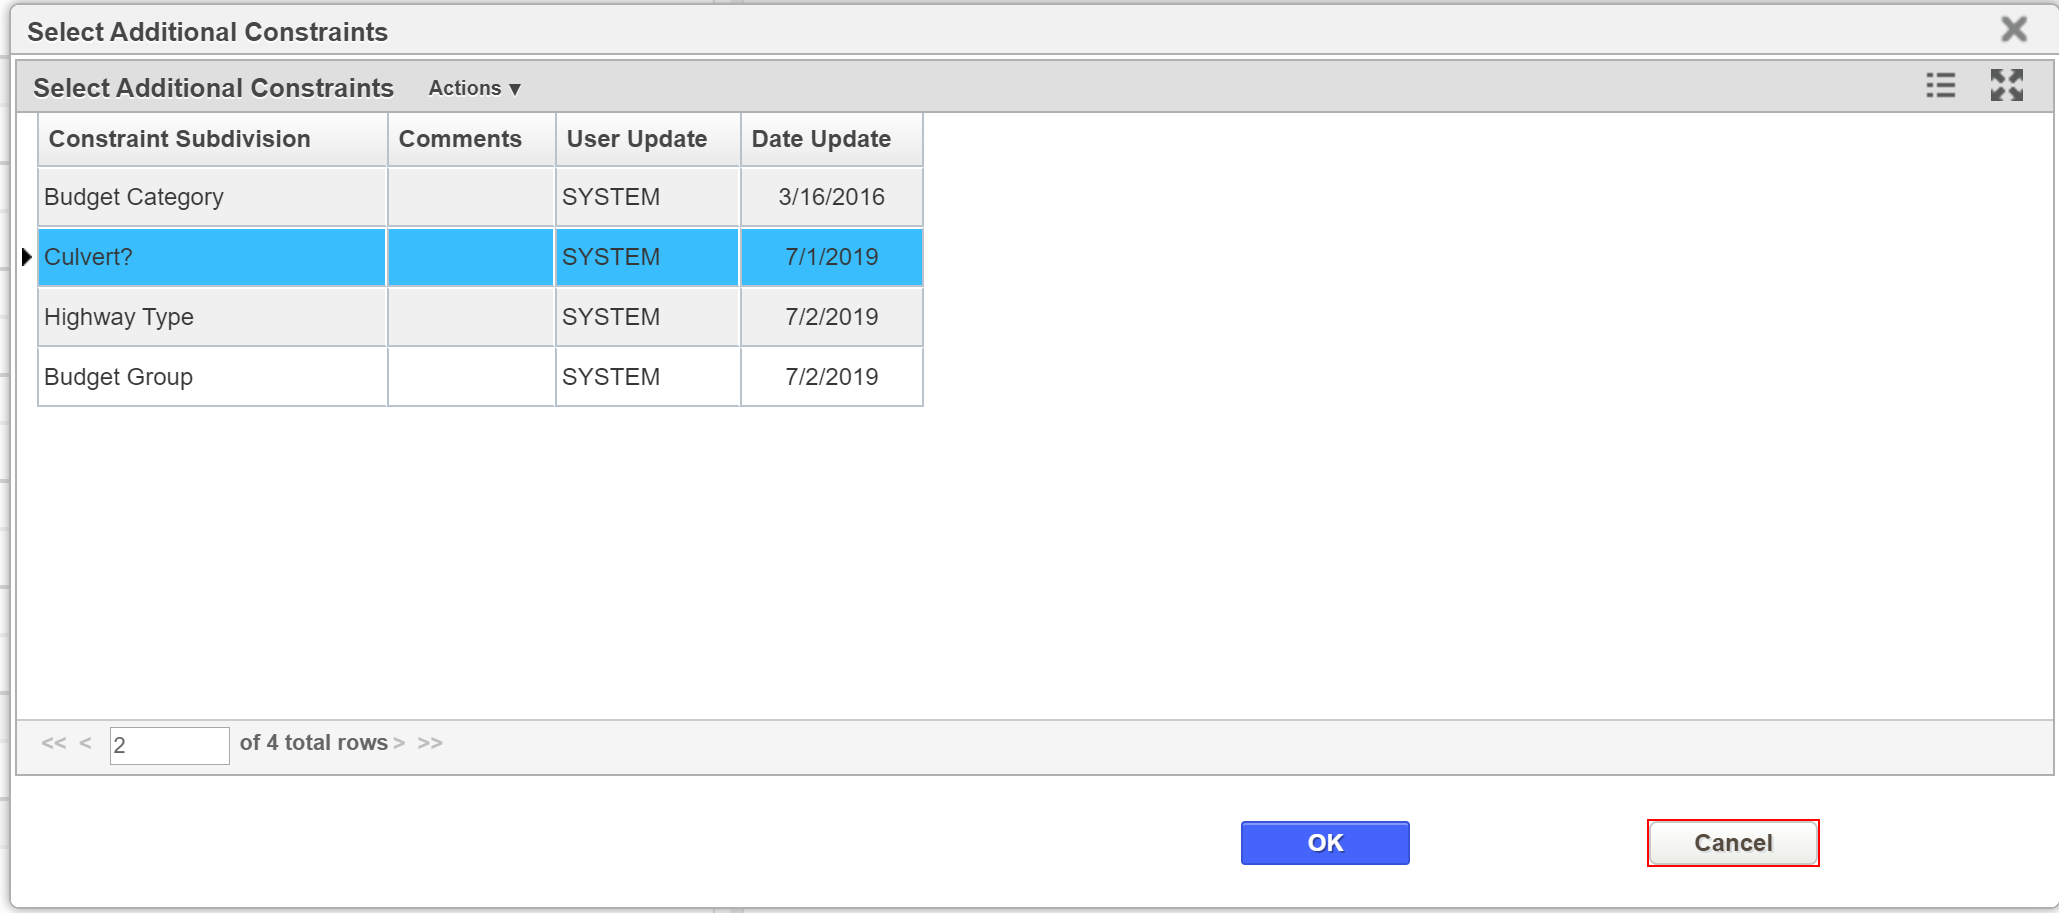
12. Right-click on the first row (in the constraints pane) and select Activate Constraint Subdivisions.
13. From the (Select Additional Constraints) pop-up that appears, click on the constraint of interest and then click the OK button.
1.3 Define Scenario Reporting Function
The objective of this lesson is for the participant to understand how to setup a report. At the end of this lesson, the user should know how to add a new reporting function in the Optimization Analysis window |
|---|
In this example, we insert a reporting function by performing the following steps:
1. Click on the Reports Setup tab.
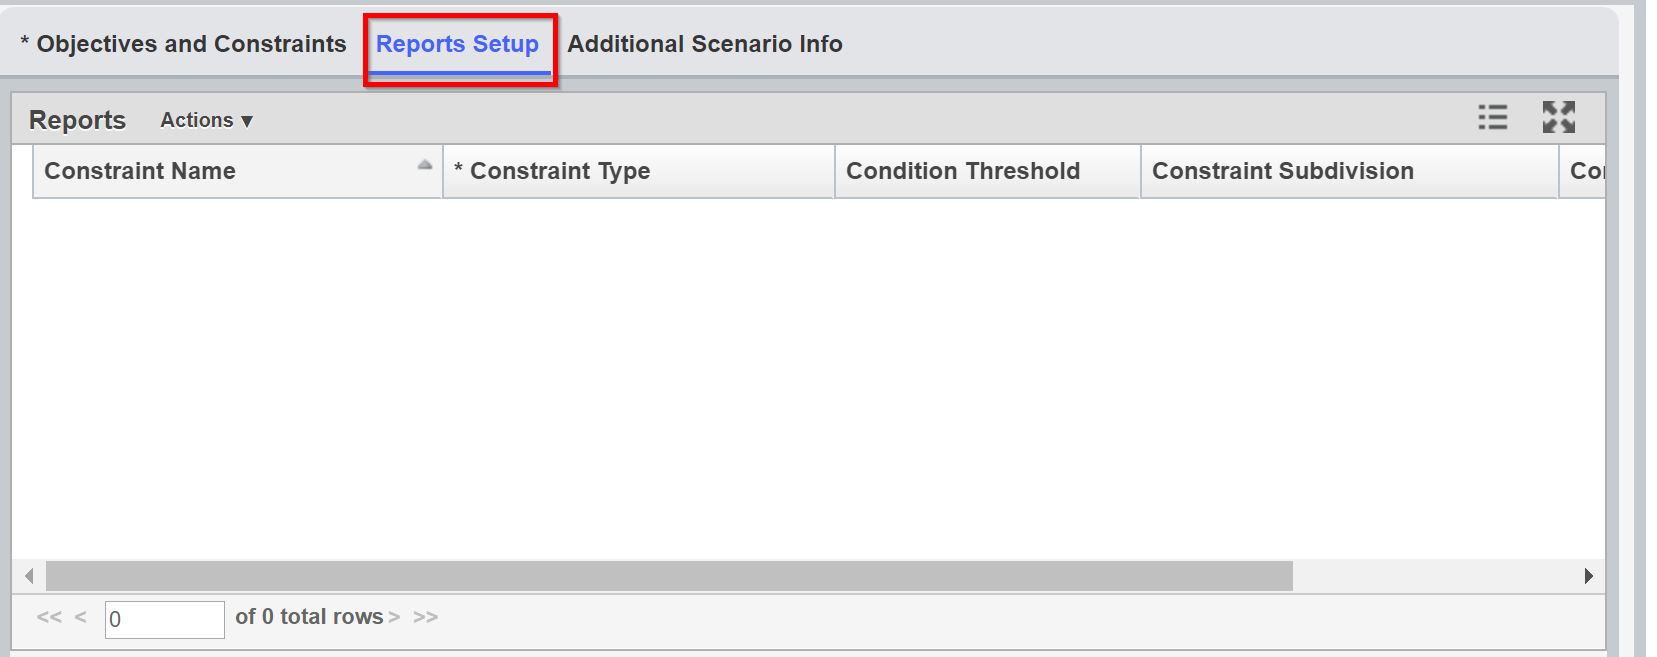
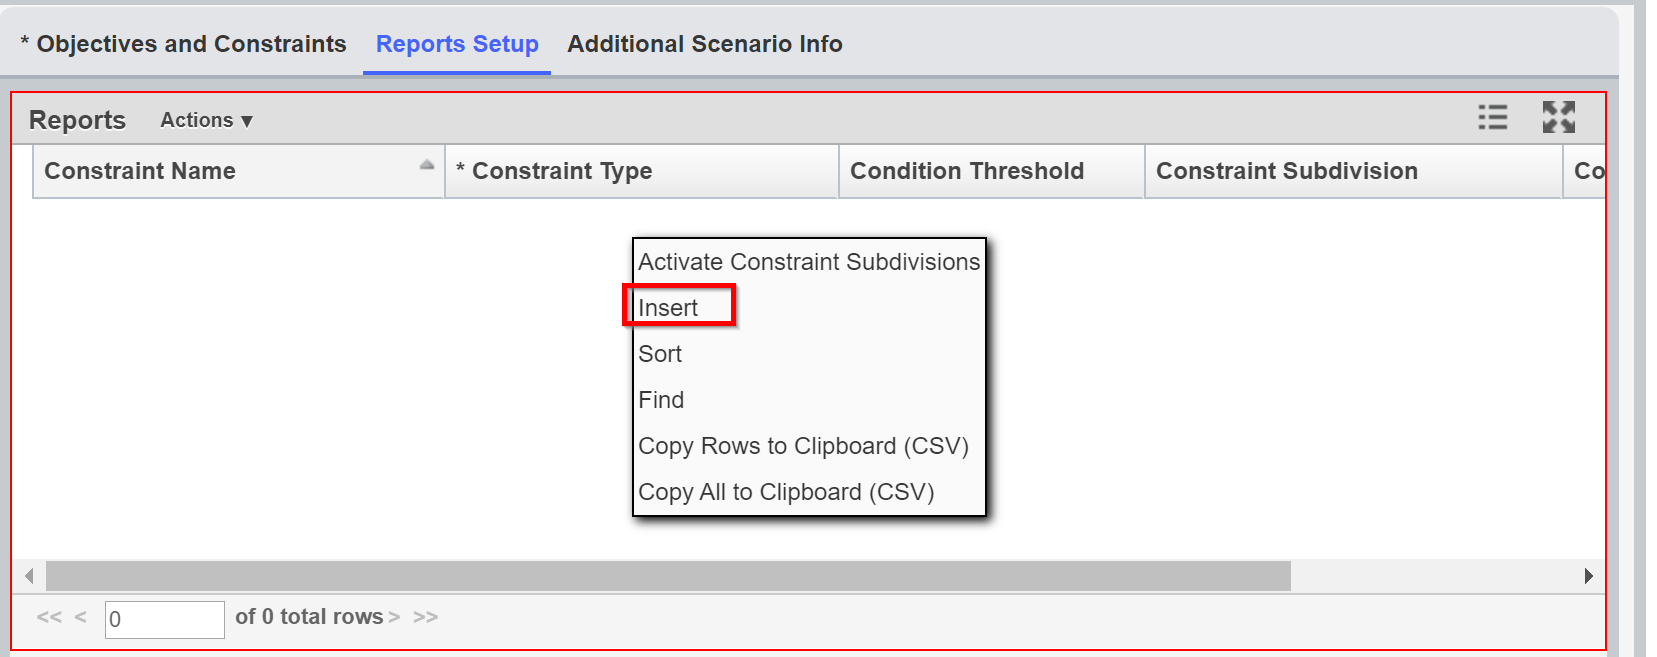
2. Right-click in the pane and select Insert.
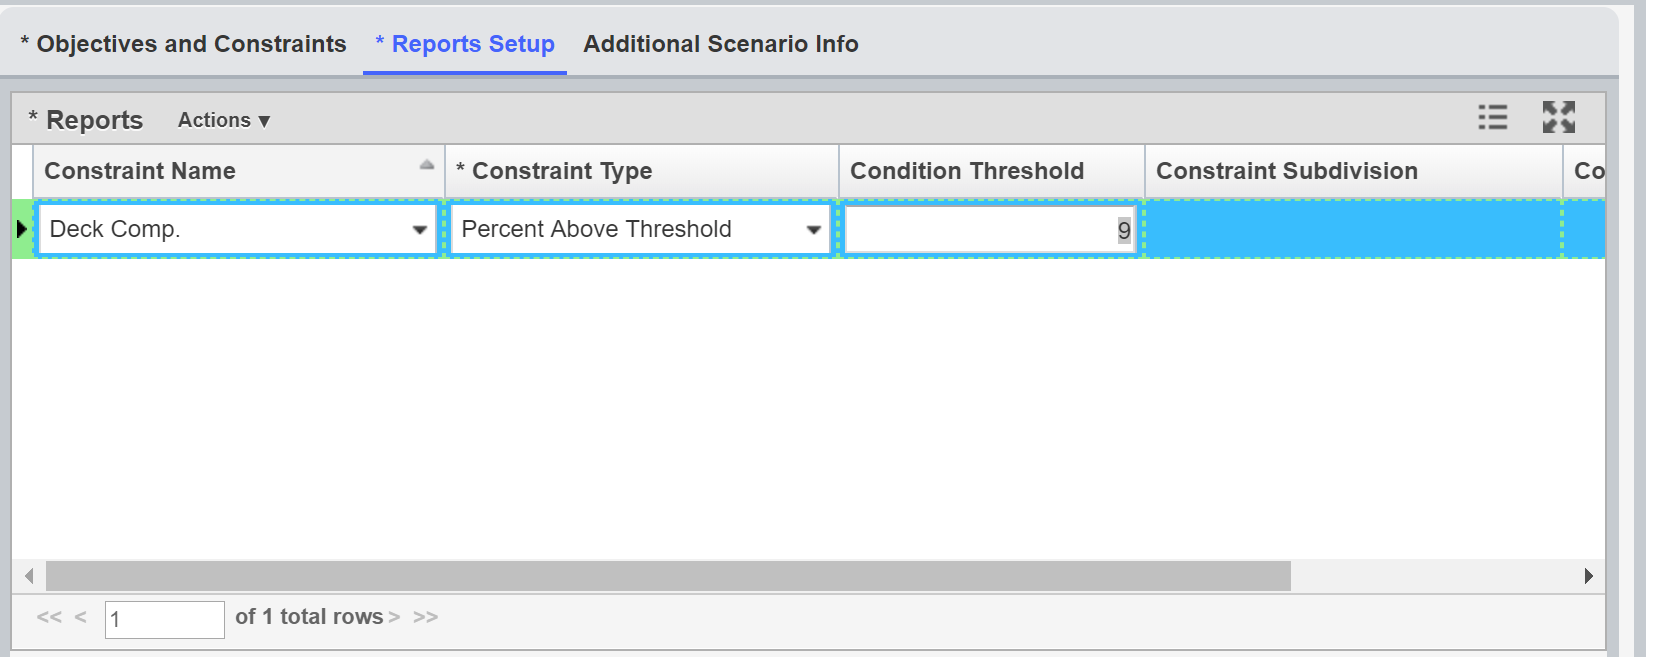
3. Click the Constraint Name drop-down and select the appropriate value.
4. Click the Constr. Type drop-down and select the appropriate value.
5. Click in the Condition Threshold field and type in the numeric value.
6. . Right-click on the row and select Activate Constraint Subdivisions.
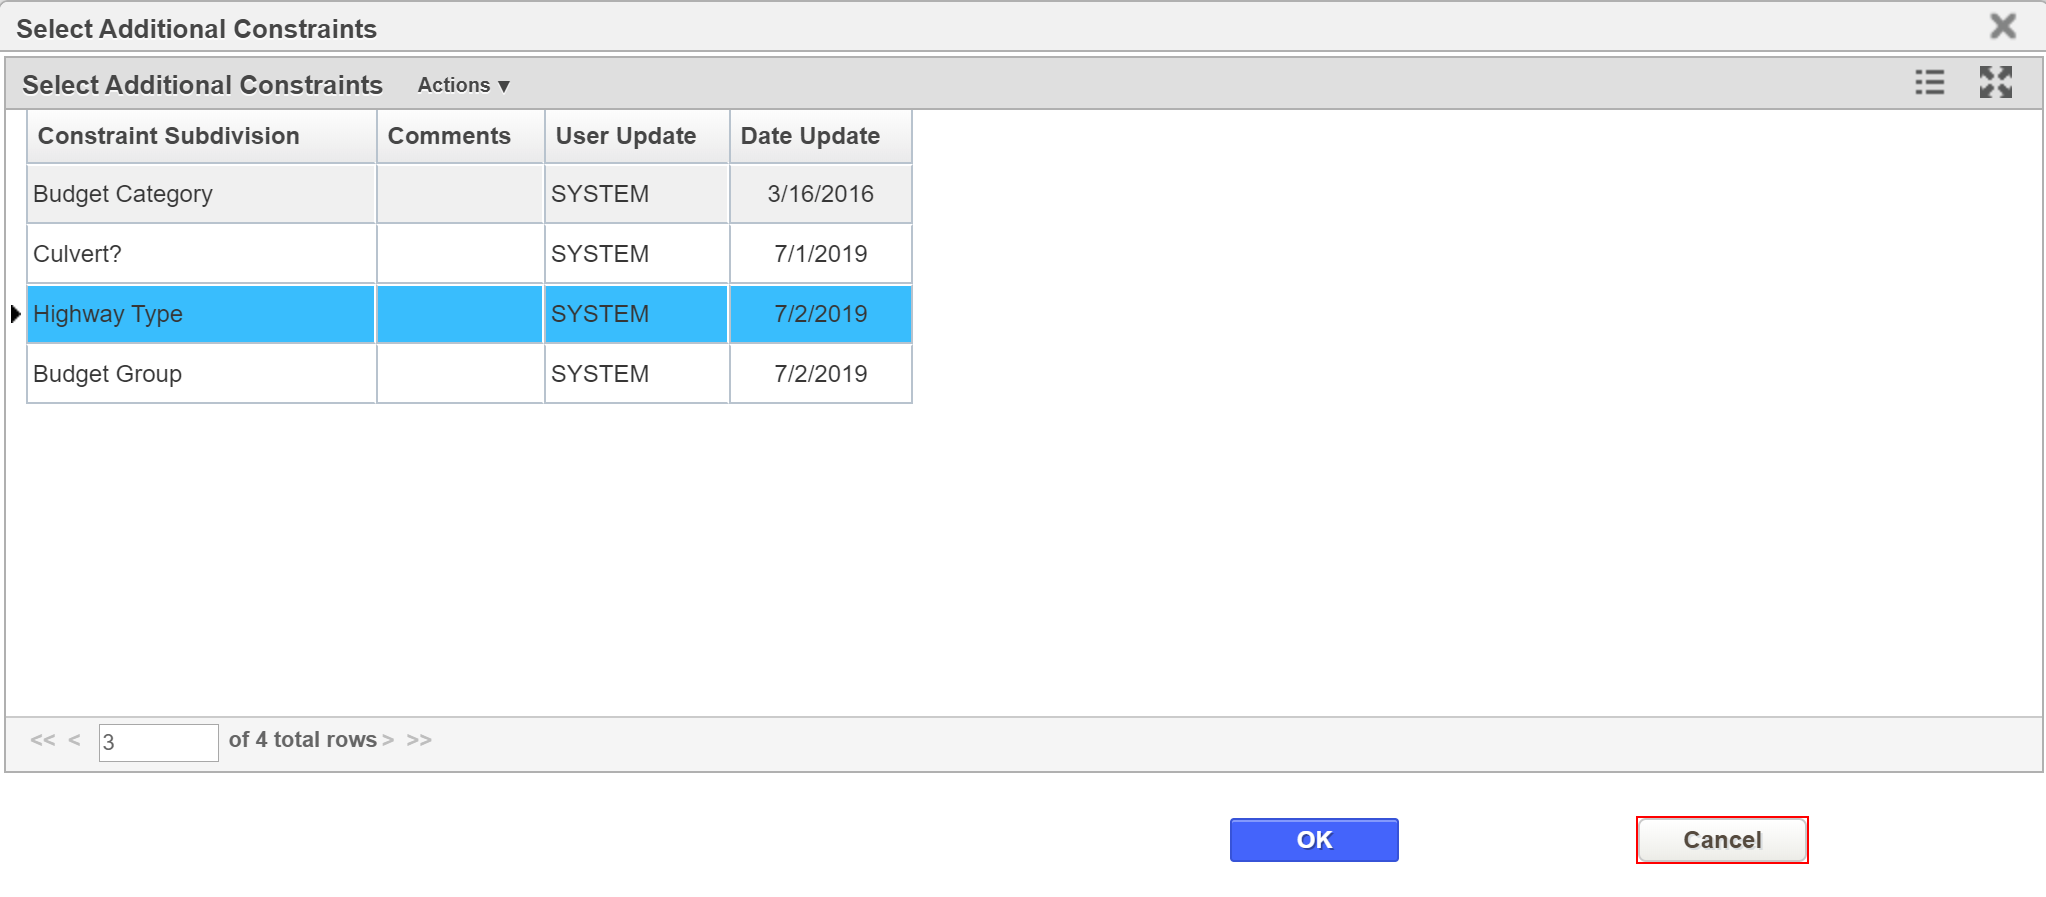
7. From the (Select Additional Constraints) pop-up that appears, click on the constraint of interest and then click the OK button.
8. Click the Save button to save the record.
Note:
After a scenario run, the Reports tab in the Optimization Scenario window displays the configured Reports.
1.4 Run Analysis Scenarios
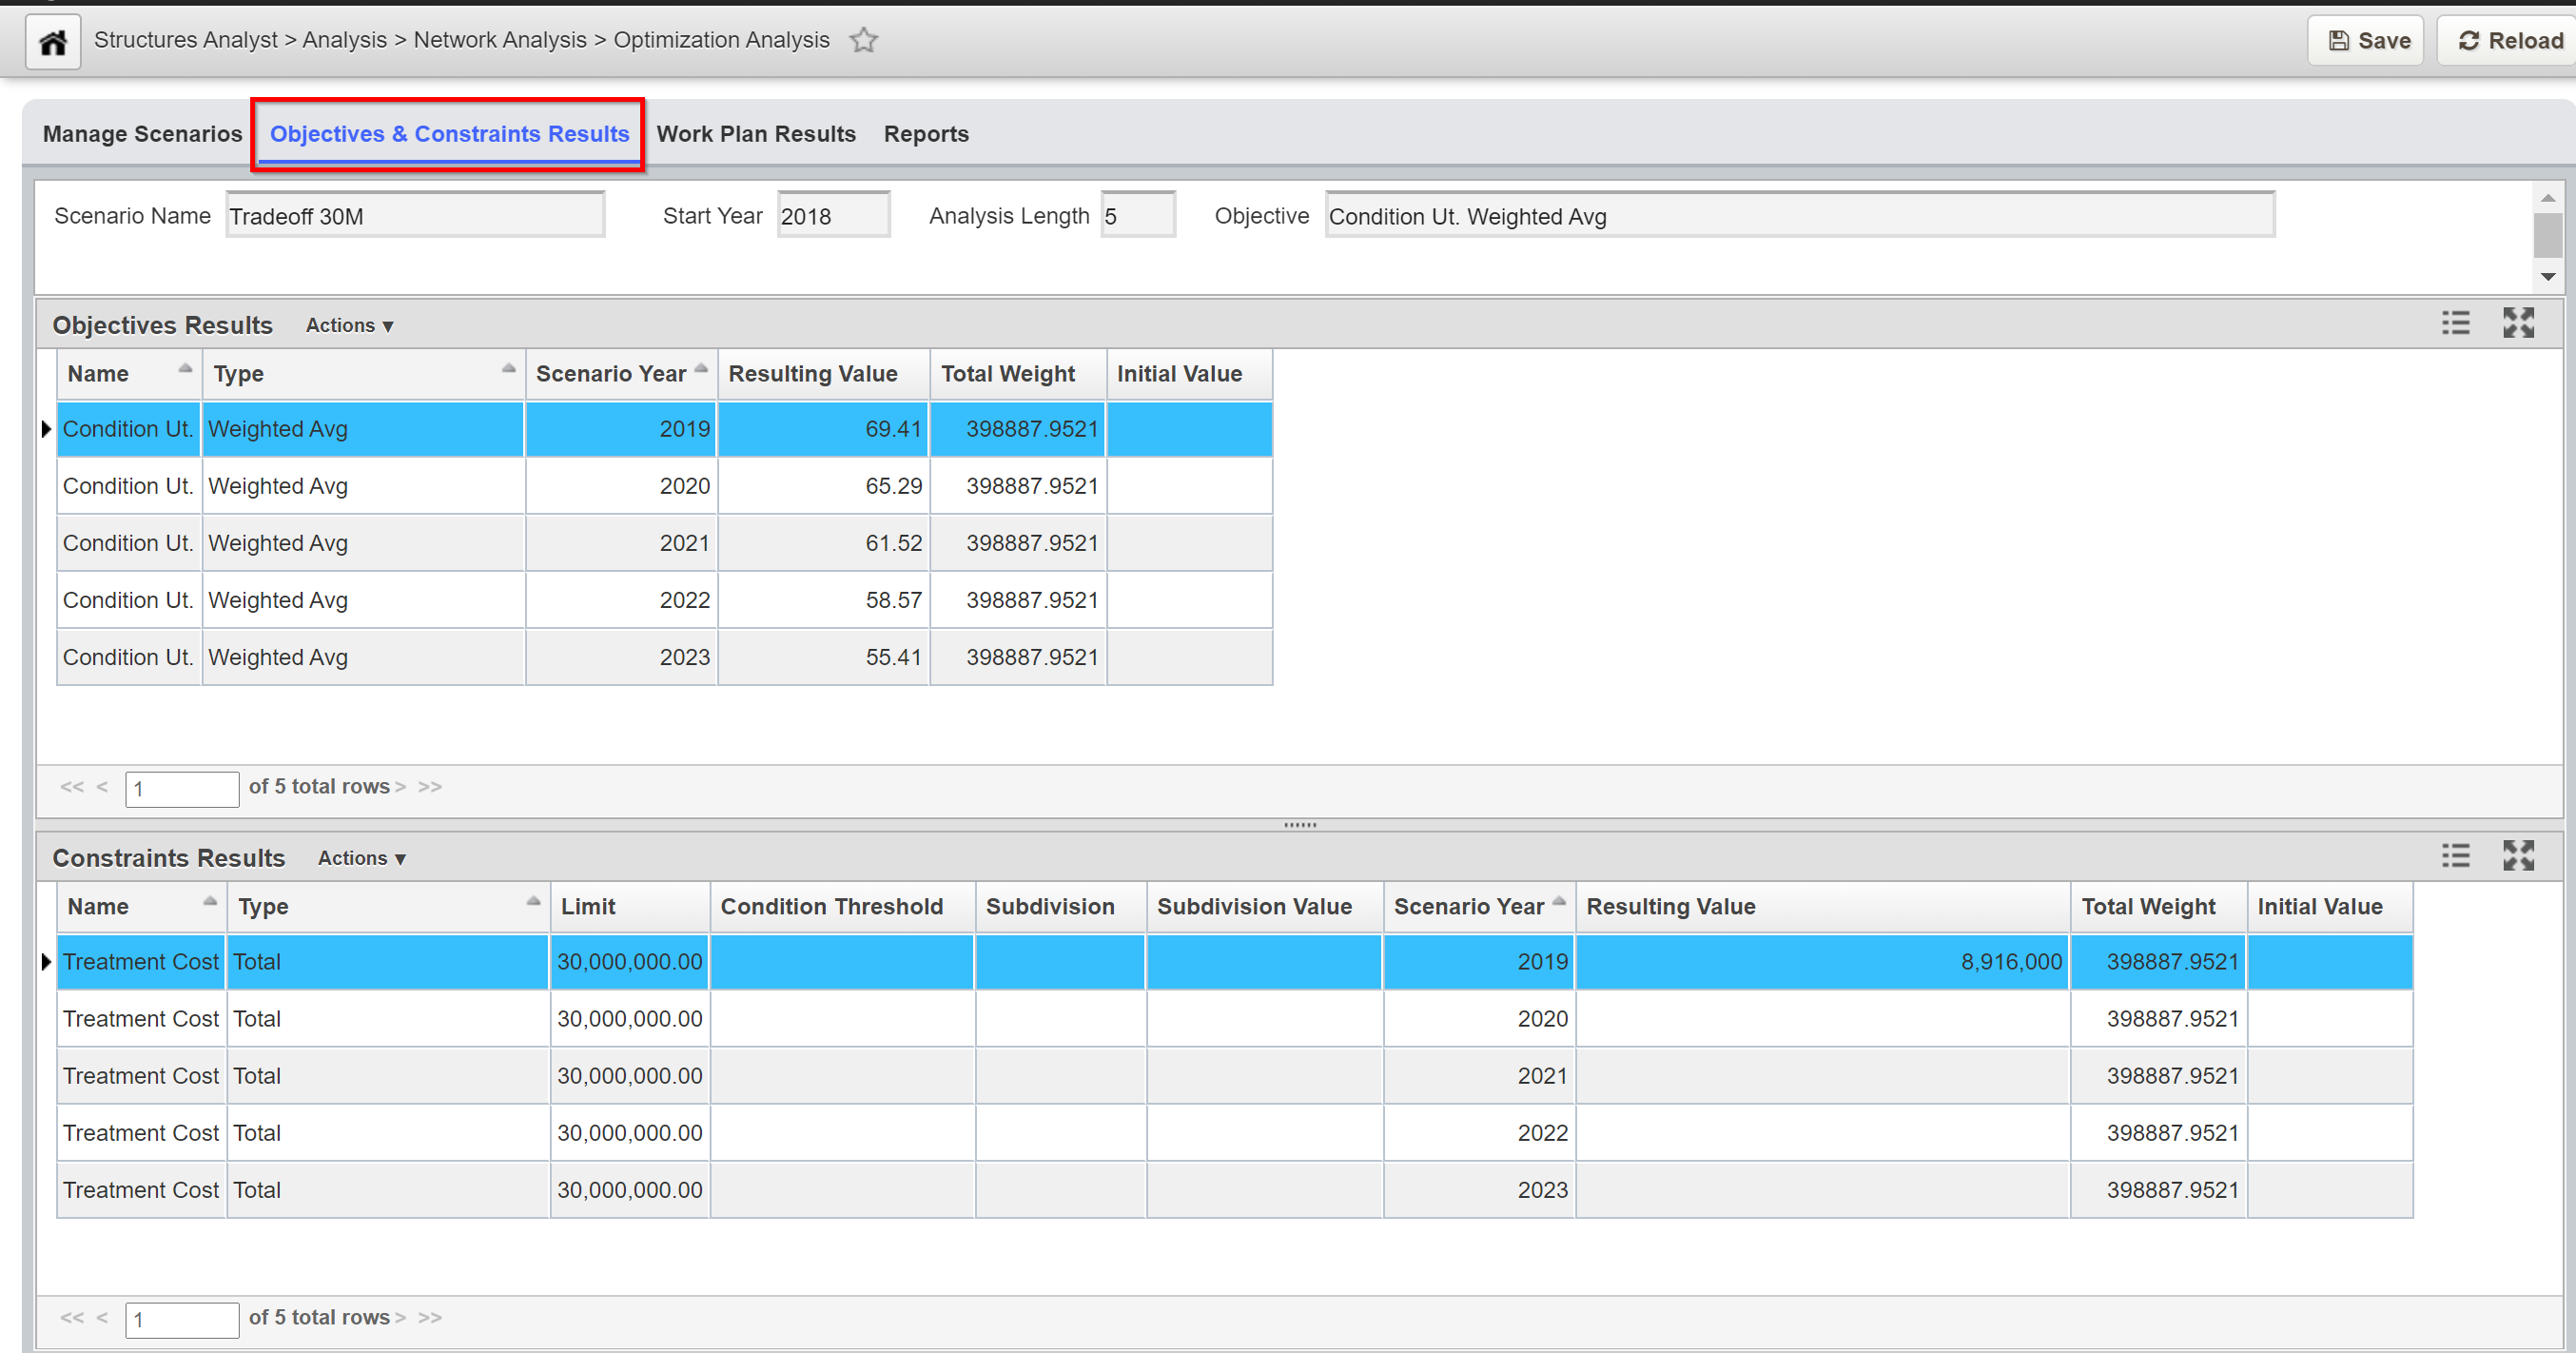
Once all constraints and reporting functions are configured, you are now ready to run the optimization. In the Scenario pane, click on the Run Scenario button. The application performs the optimization and then displays the results under the Objectives & Constraints Results tab.
1.5.1 Review Objective & Constraints Results
The Objective & Constraints Results tab of the Optimization Analysis window provides the result lists for the scenario. The Objective Results pane shows the selected objective for the scenario year. The Constraints Results pane shows the predicted values of each constraint compared to the input constraint value. This allows you to identify the constraints that have controlled the analysis results.
1.5.2 Review Work Plan Results
The Work Plan Results tab of the Optimization Analysis window provides a list of work plans produced by the optimization routine, based upon the input criteria configured in the Setup tab.

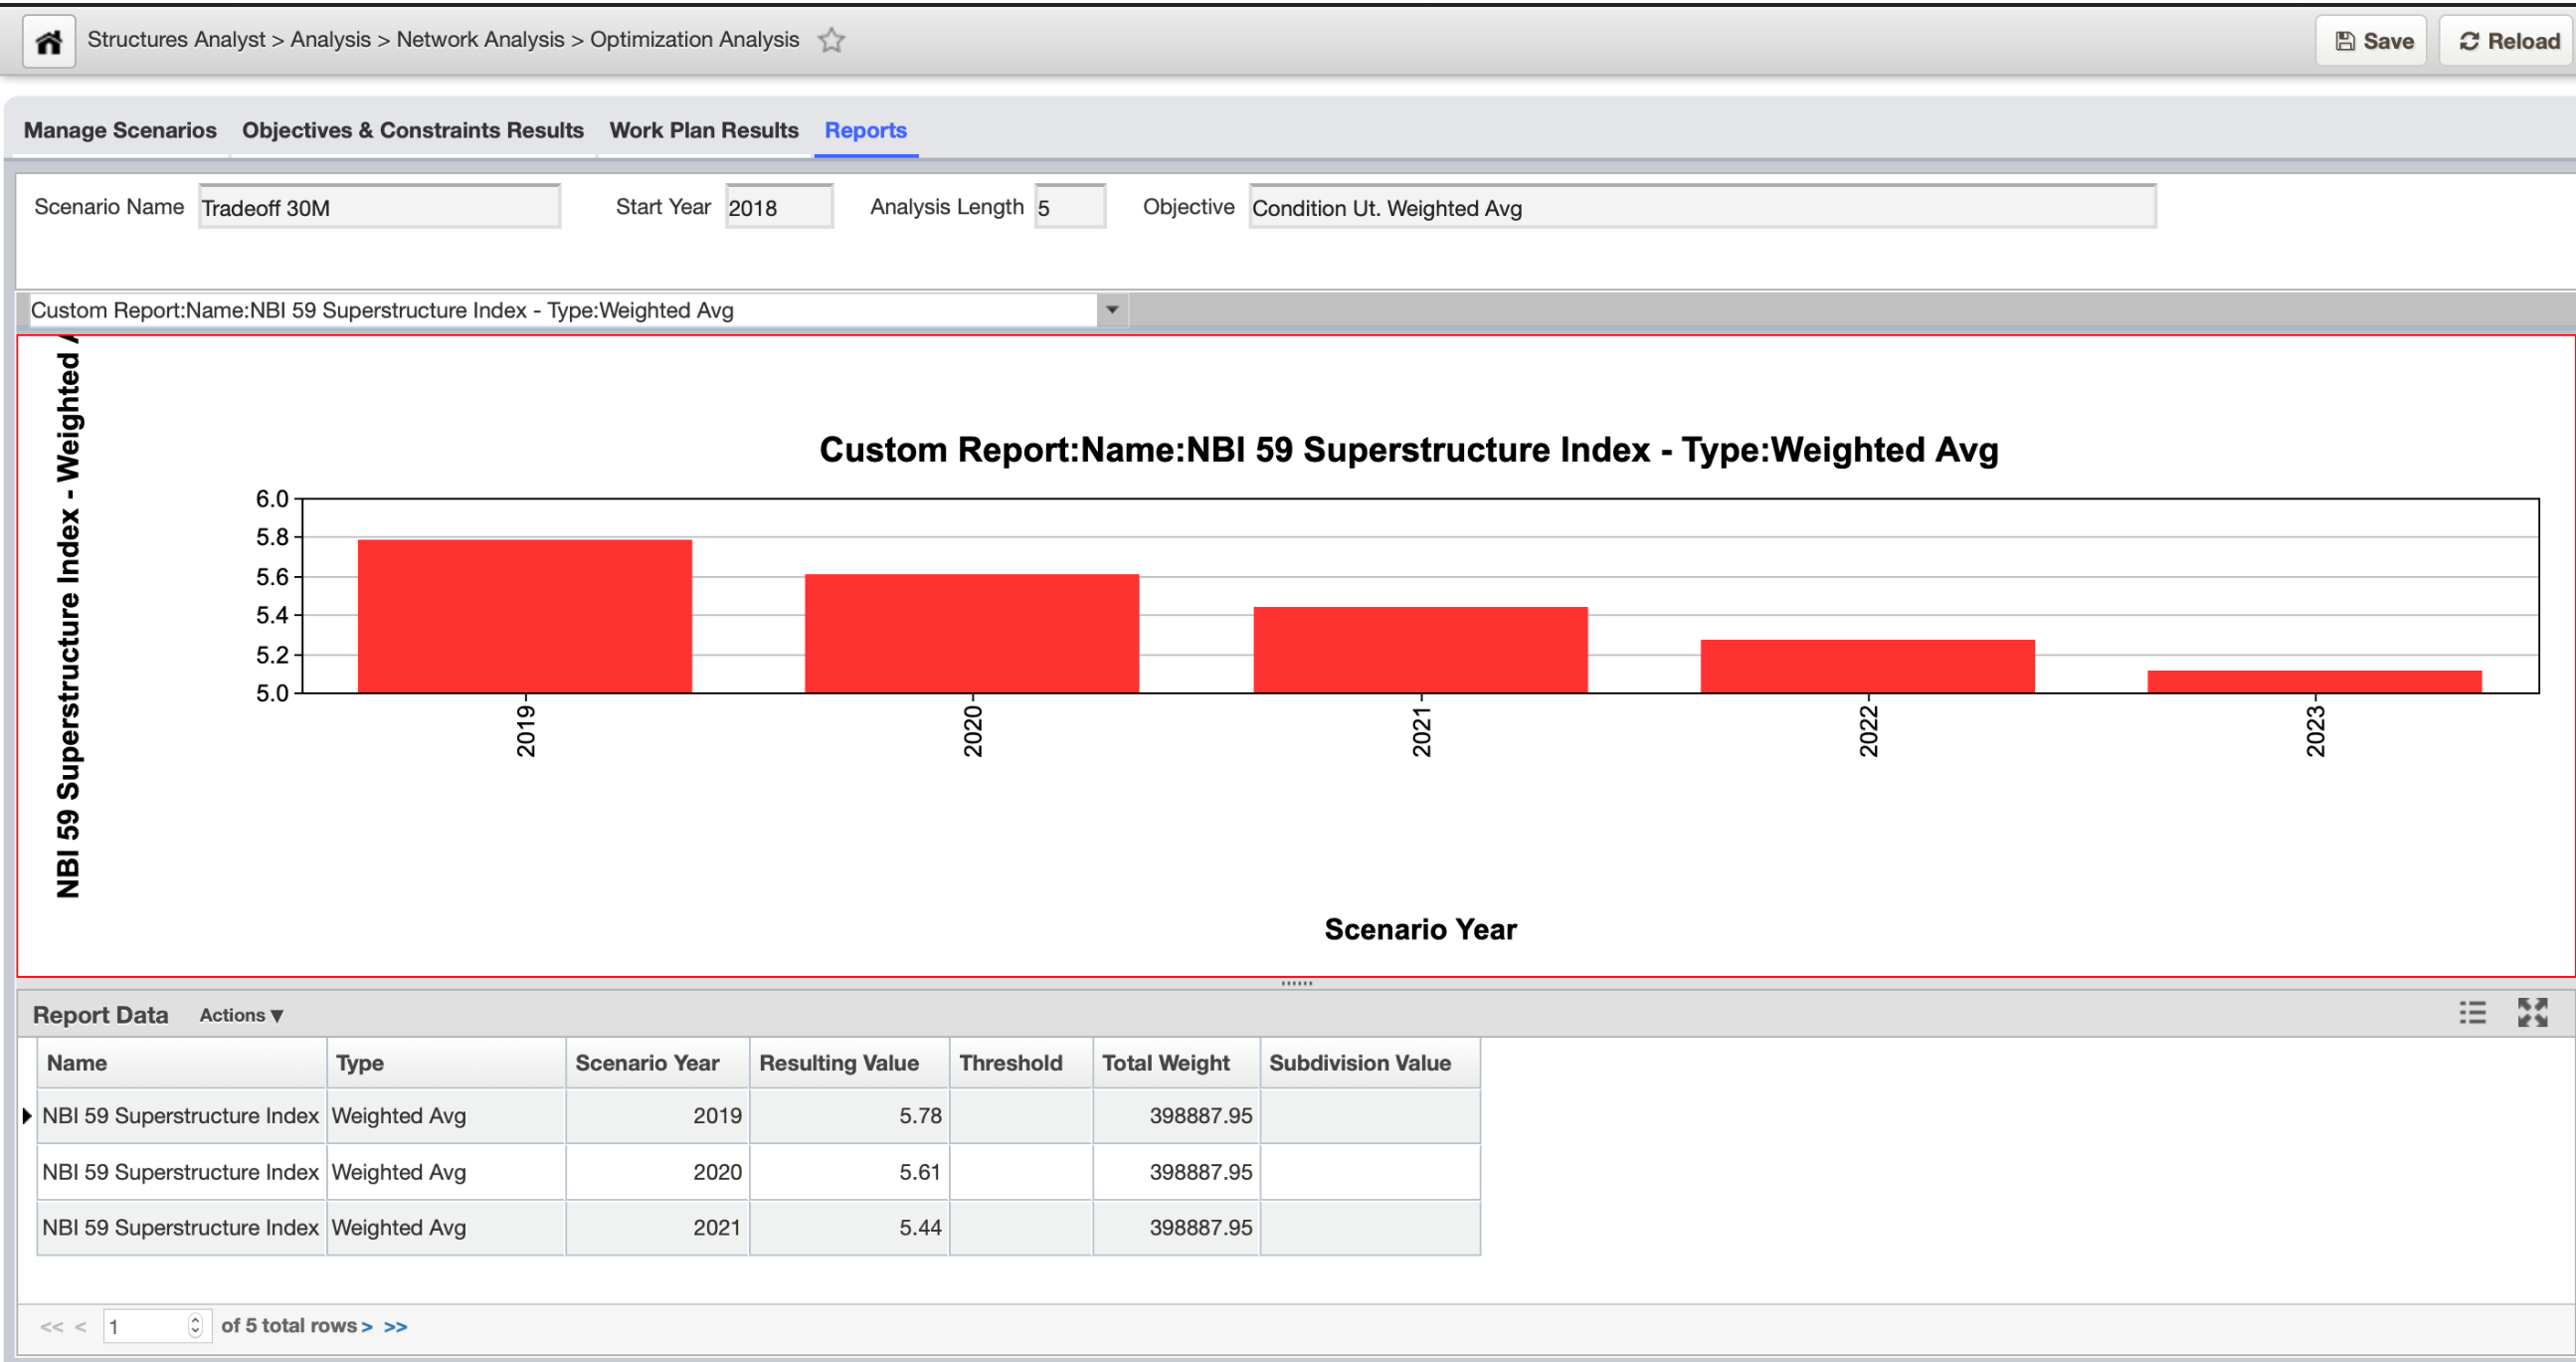
1.5.3 Review Reports
The Report tab of the Optimization Analysis window shows the constraints you selected in the Reporting Functions pane of the Setup tab and the values of the constraints.
The right pane shows a graph of the values of a particular constraint (which is selected from the drop-down list field shown at the top of the pane). The Y-axis of the graph shows constraint values and the X-axis shows the number of years in the analysis. The graph is a line graph for all constraint types except Total, which is a bar graph. You may modify the appearance of the graph by using the right-click Change Graph Properties commands.