Pavement management systems (PMS) was developed to manage pavement network asset inventories, collect condition data, predict performance for various management decisions and report the results to support decision-making needed to meet performance and cost objectives.
AgileAssets Pavement Analyst™ is a fully functional PMS designed to help users manage the pavement network effectively. The software assists decision-makers in the process of managing pavement networks and comes with the following four out-of-box data sets (Roadway (Asset Inventory, Pavement Condition, Traffic, and Pavement Structure (Construction History).
Because datasets usually come from separate areas of the organization and are typically collected/measured using different criteria, one major component of the system is to provides methods for summarizing and aggregating these disparate data sources. This summarization/aggregation process produces “master files,” which serve as the basis for all data analysis within the system. Once the master files are produced, the system allows two basic types of data analysis.
- Network Analysis – Used to develop an optimum construction/replacement, maintenance and rehabilitation strategy for the pavement network. This analysis uses Network Master Files.
- Performance Analysis – Used to develop the equations that predict the condition of all sections within the network. The equations can then be used as input to Network Analysis. Performance Analysis uses Performance Master Files.
Pavement Asset Inventory
Roadway (Asset) Inventory
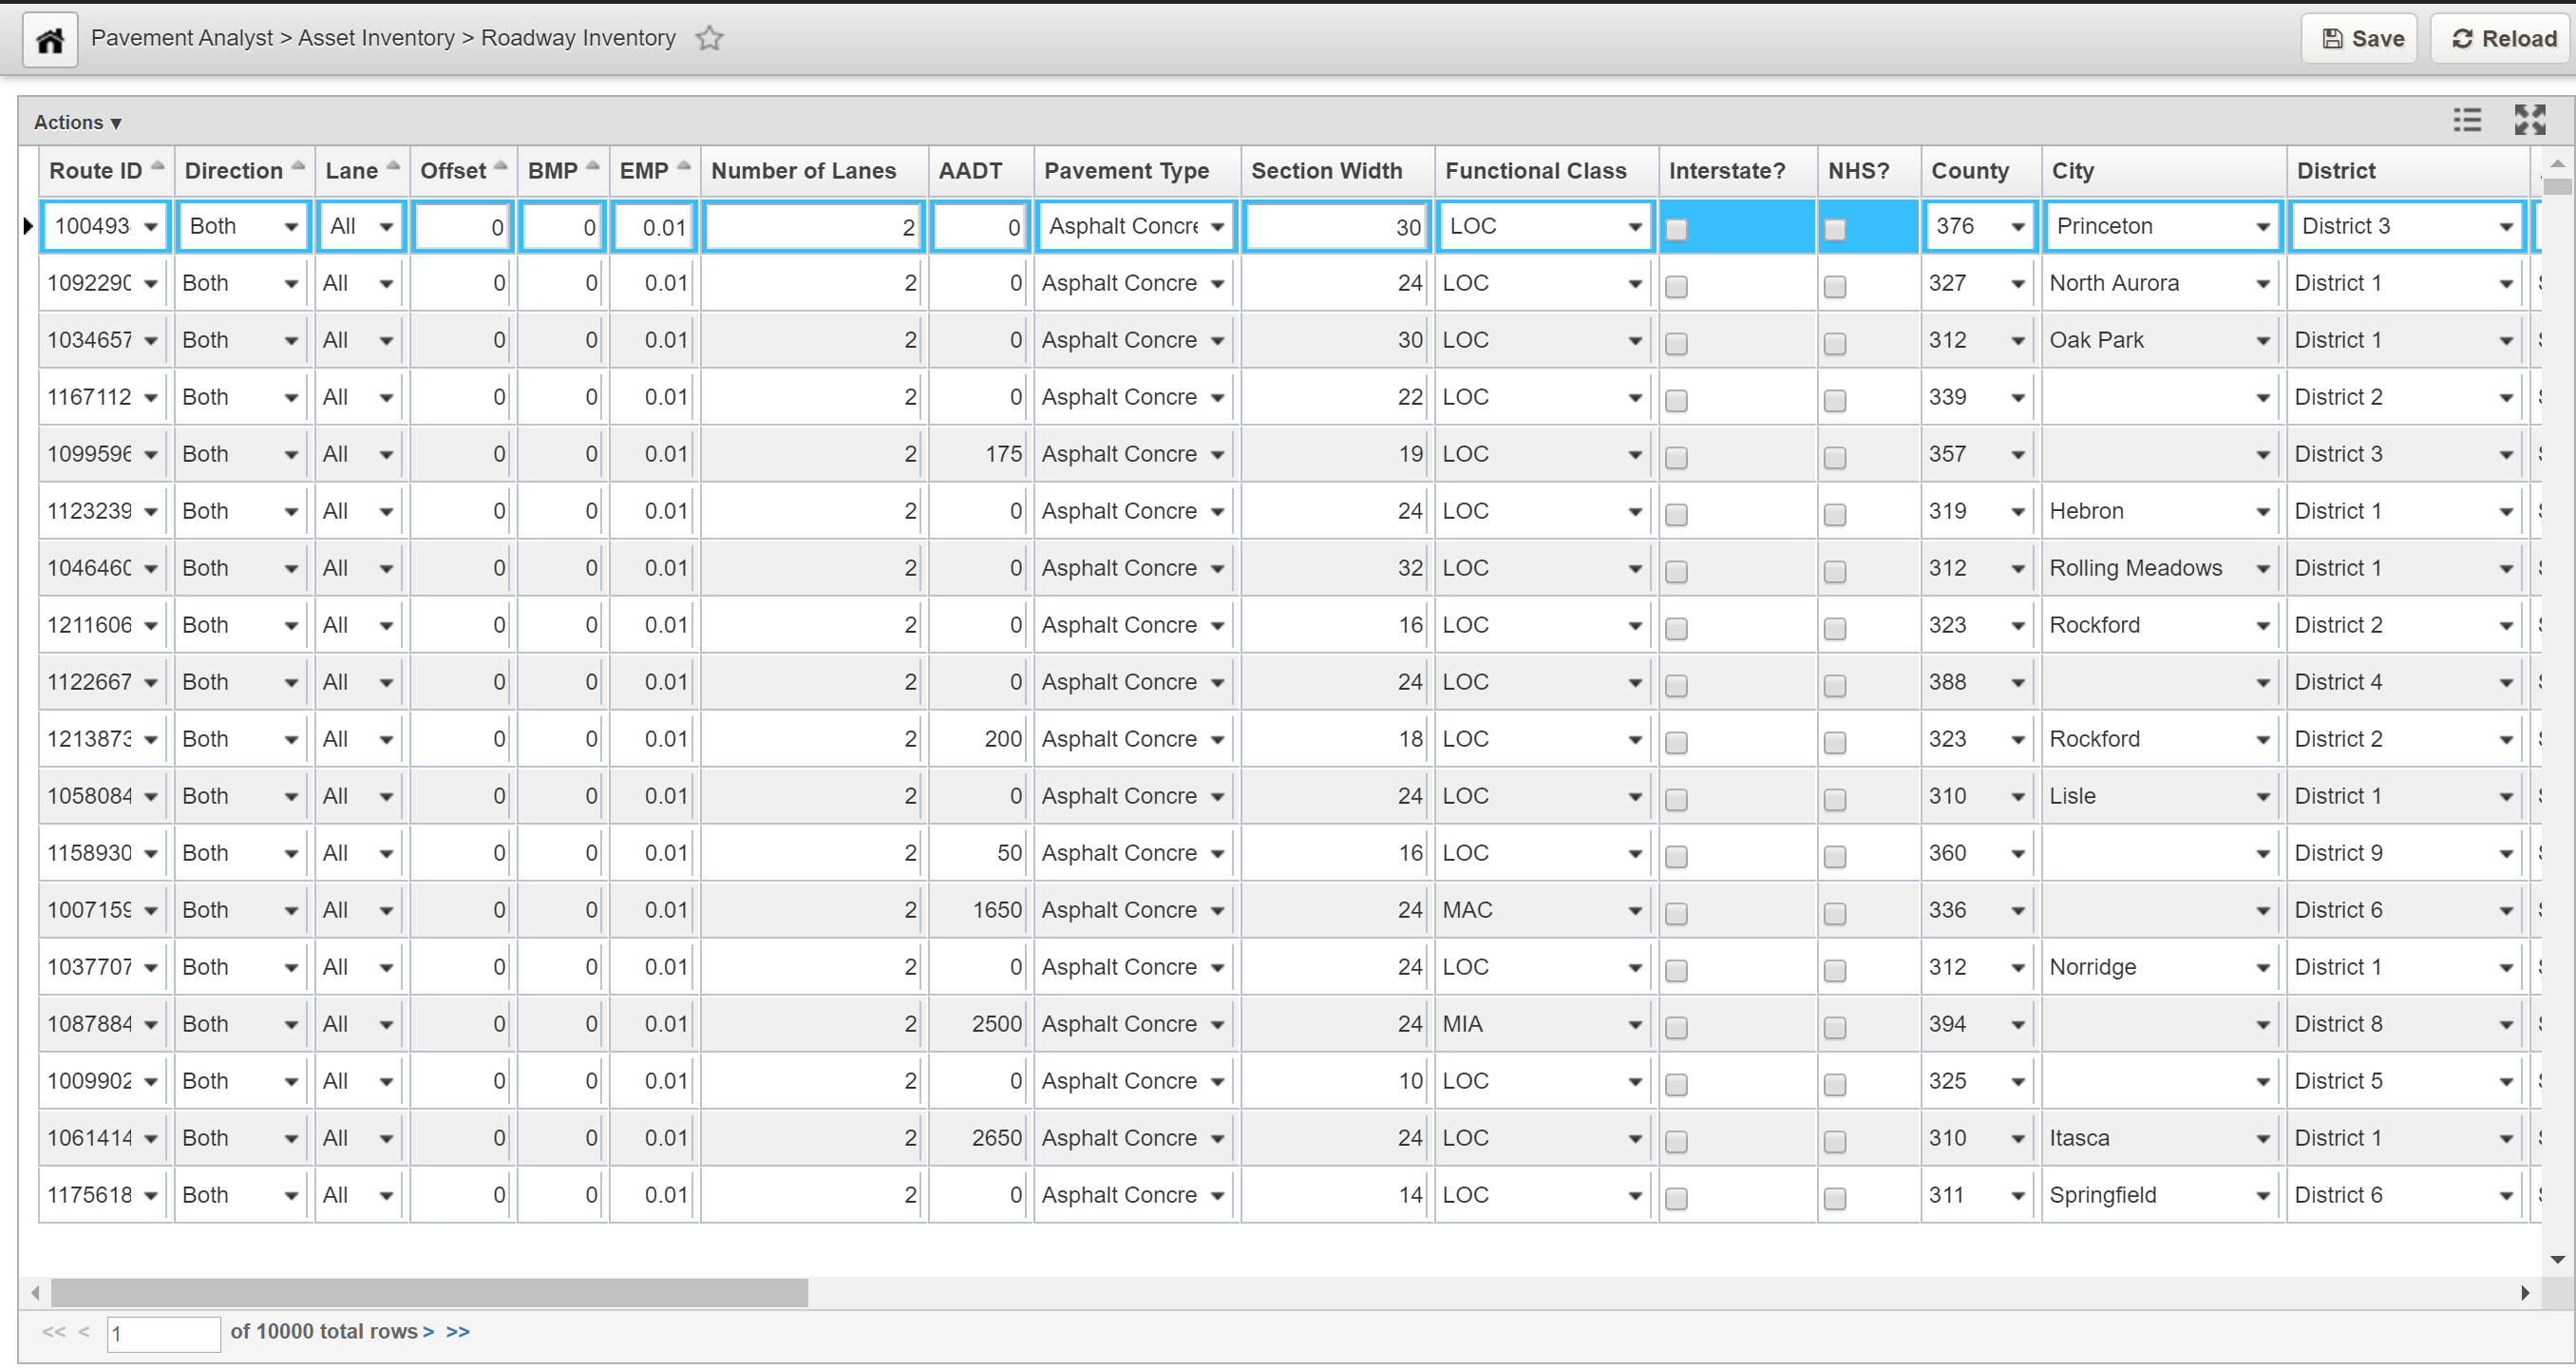
Roadway Inventory is for storing various roadway characteristics and their locations, such as Functional Class, Number of Lanes, Lane Width, Shoulder Width, etc. Click Here for Pavement Management System Basic Exercises
The objective of this lesson is for the participant to understand how to access to the Roadway Inventory window. At the end of this lesson, the user should be able to successfully log into the system and open the Roadway Inventory window. |
|---|
In this example, we open the Roadway Inventory window by following the steps below:
- In the Pavement module, navigate to: Pavement Analyst > Asset Inventory > Roadway Inventory
- From there you can browse through the Roadway Inventory records or right-click to use the Sort/Search/Filter functions to locate a specific record.
Roadway Inventory window
Pavement Condition
Describes the condition of the road, usually coming from the Pavement Condition Survey. It also stores the annual pavement condition survey results and their locations, such as IRI, Rutting, Faulting, Cracking, etc. Out of the box, the table is named PMS_AUTOMATED_CONDITION_SURVEY, and the corresponding window is located under Pavement Analyst > Asset Performance > Automated Condition Survey > Automated Condition Survey Data menu.
Traffic Data
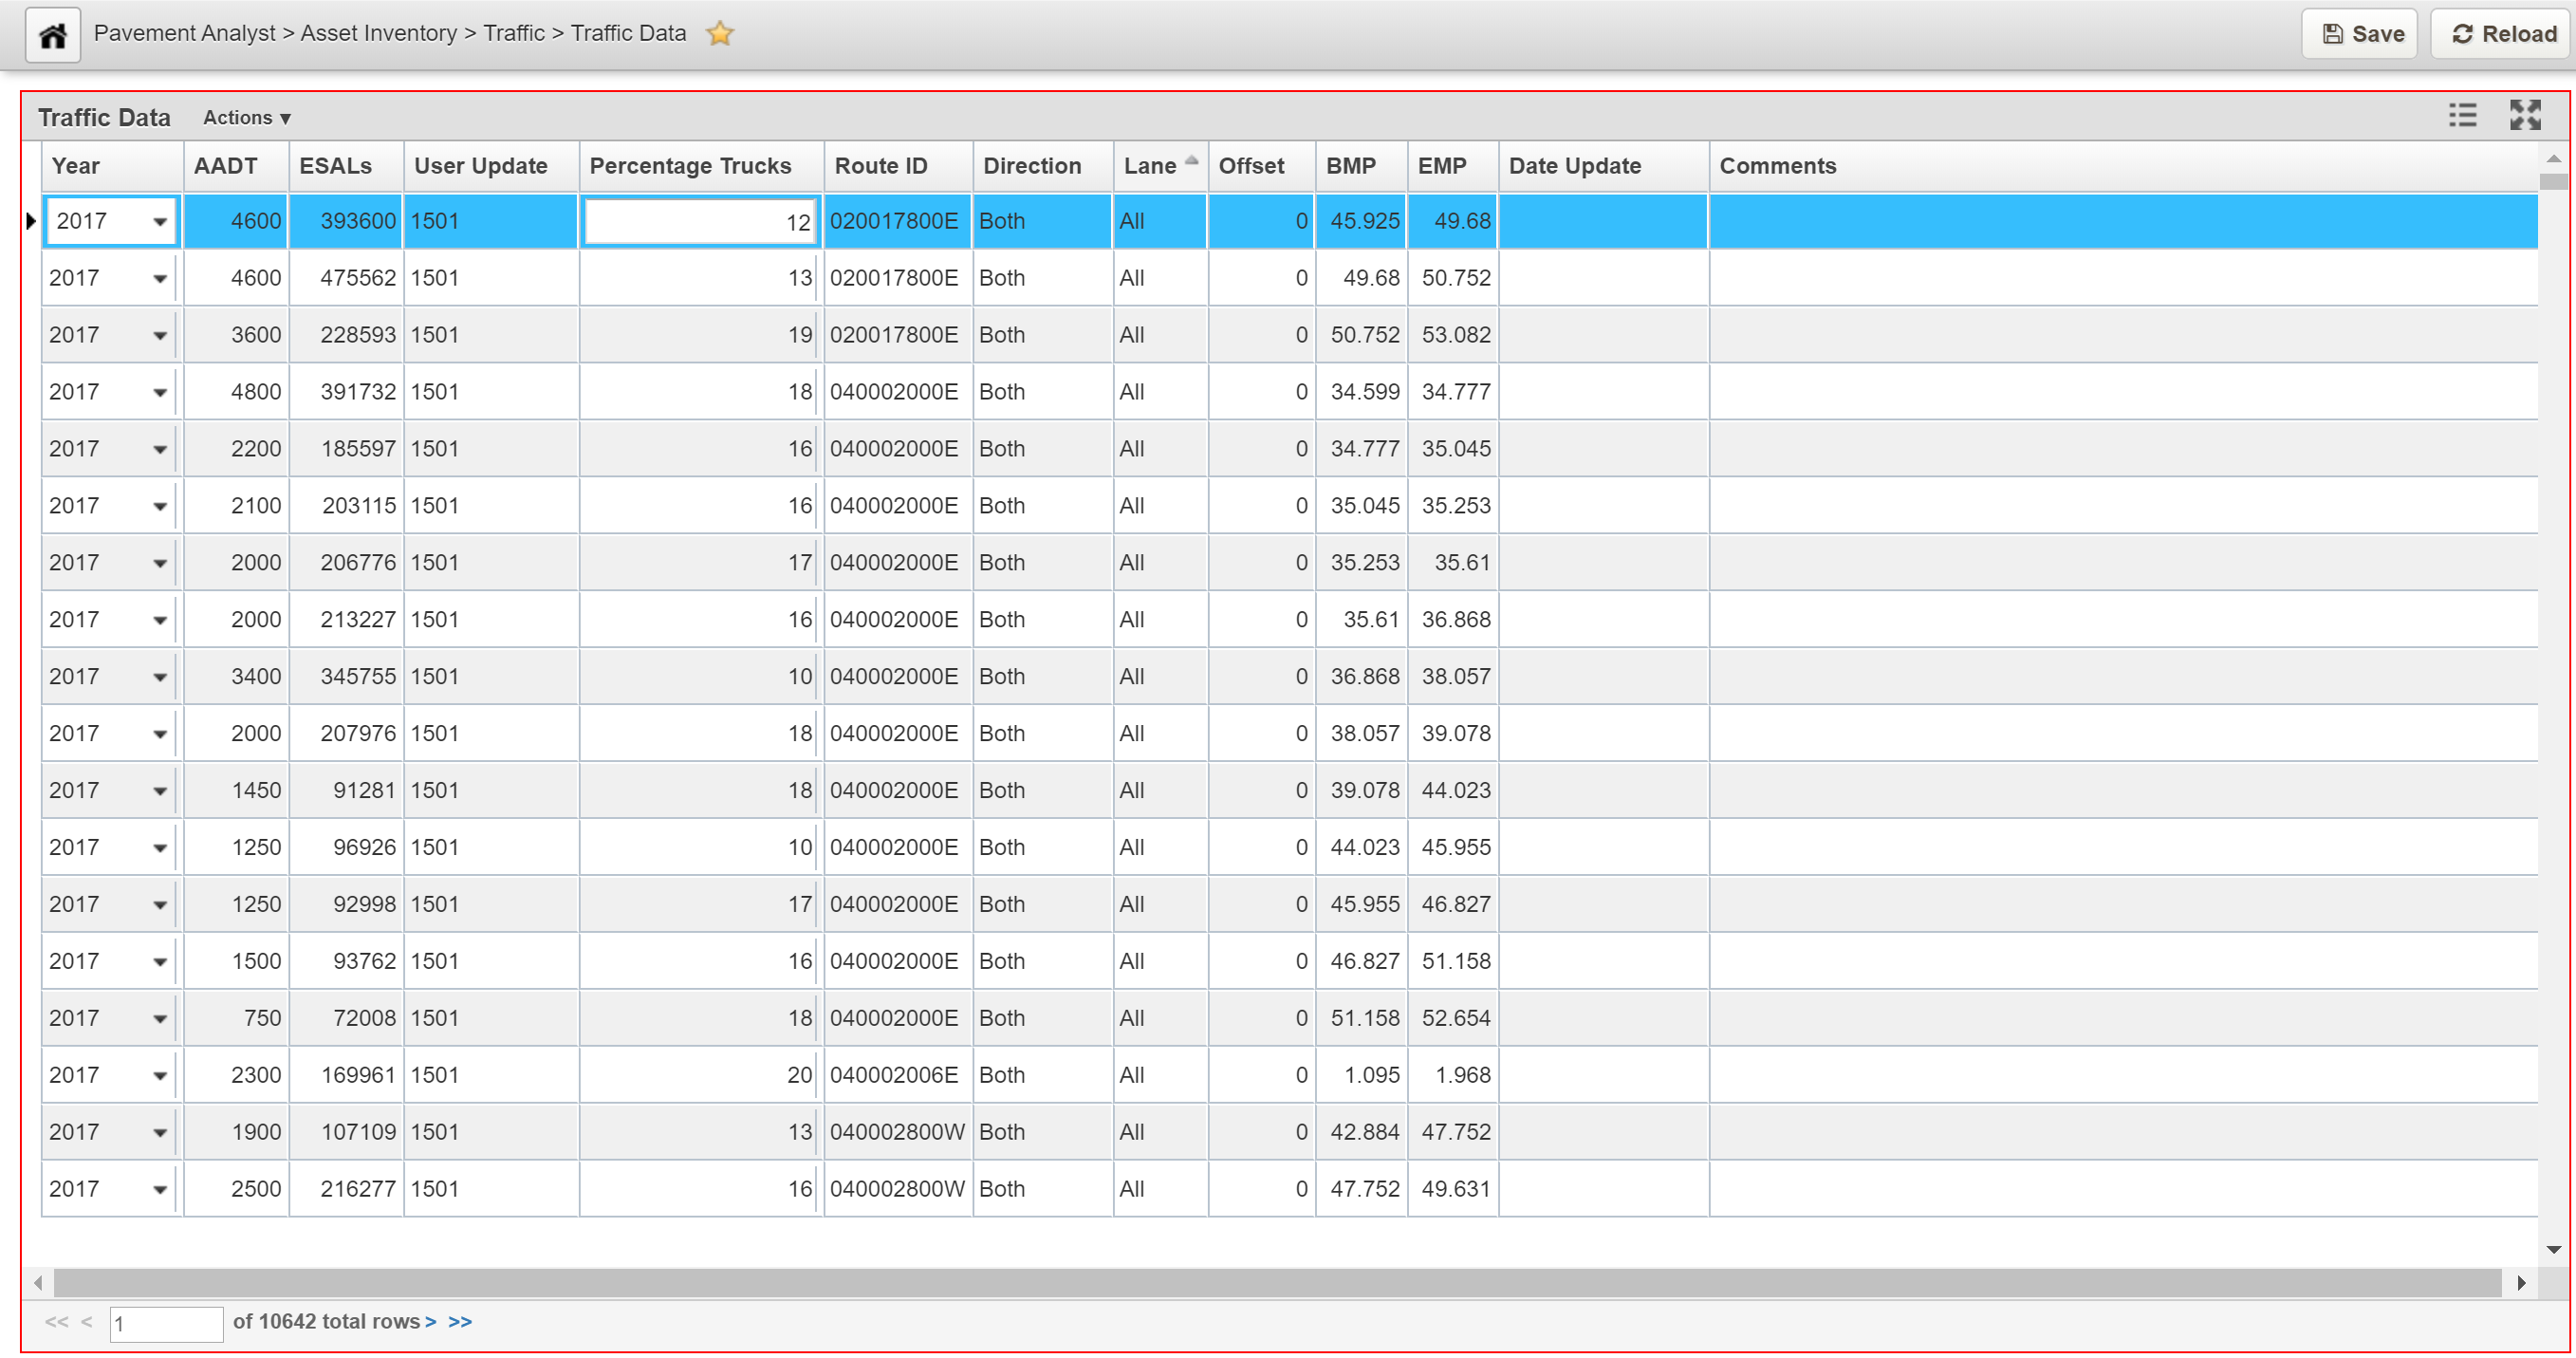
The Traffic Data window provides information on traffic volume of each road, usually collected at intersections and in the form of annual average daily traffic (AADT) and truck percentages, etc. Out of the box, the table is named PMS_TRAFFIC, and the corresponding window is located under Pavement Analyst > Asset Inventory > Traffic > Traffic Data menu.
The objective of this lesson is for the participant to understand how to access to the Traffic Data window. At the end of this lesson, the user should be able to successfully log into the system and open the Traffic Data window. |
|---|
In this example, we open the Traffic Data window by following the steps below:
- In the Pavement module, navigate to: Pavement Analyst > Asset Inventory > Traffic > Traffic Data.
- From there you can browse through the Traffic Data records or right-click to use the Sort/Search/Filter functions to locate a specific record.
Traffic Data window
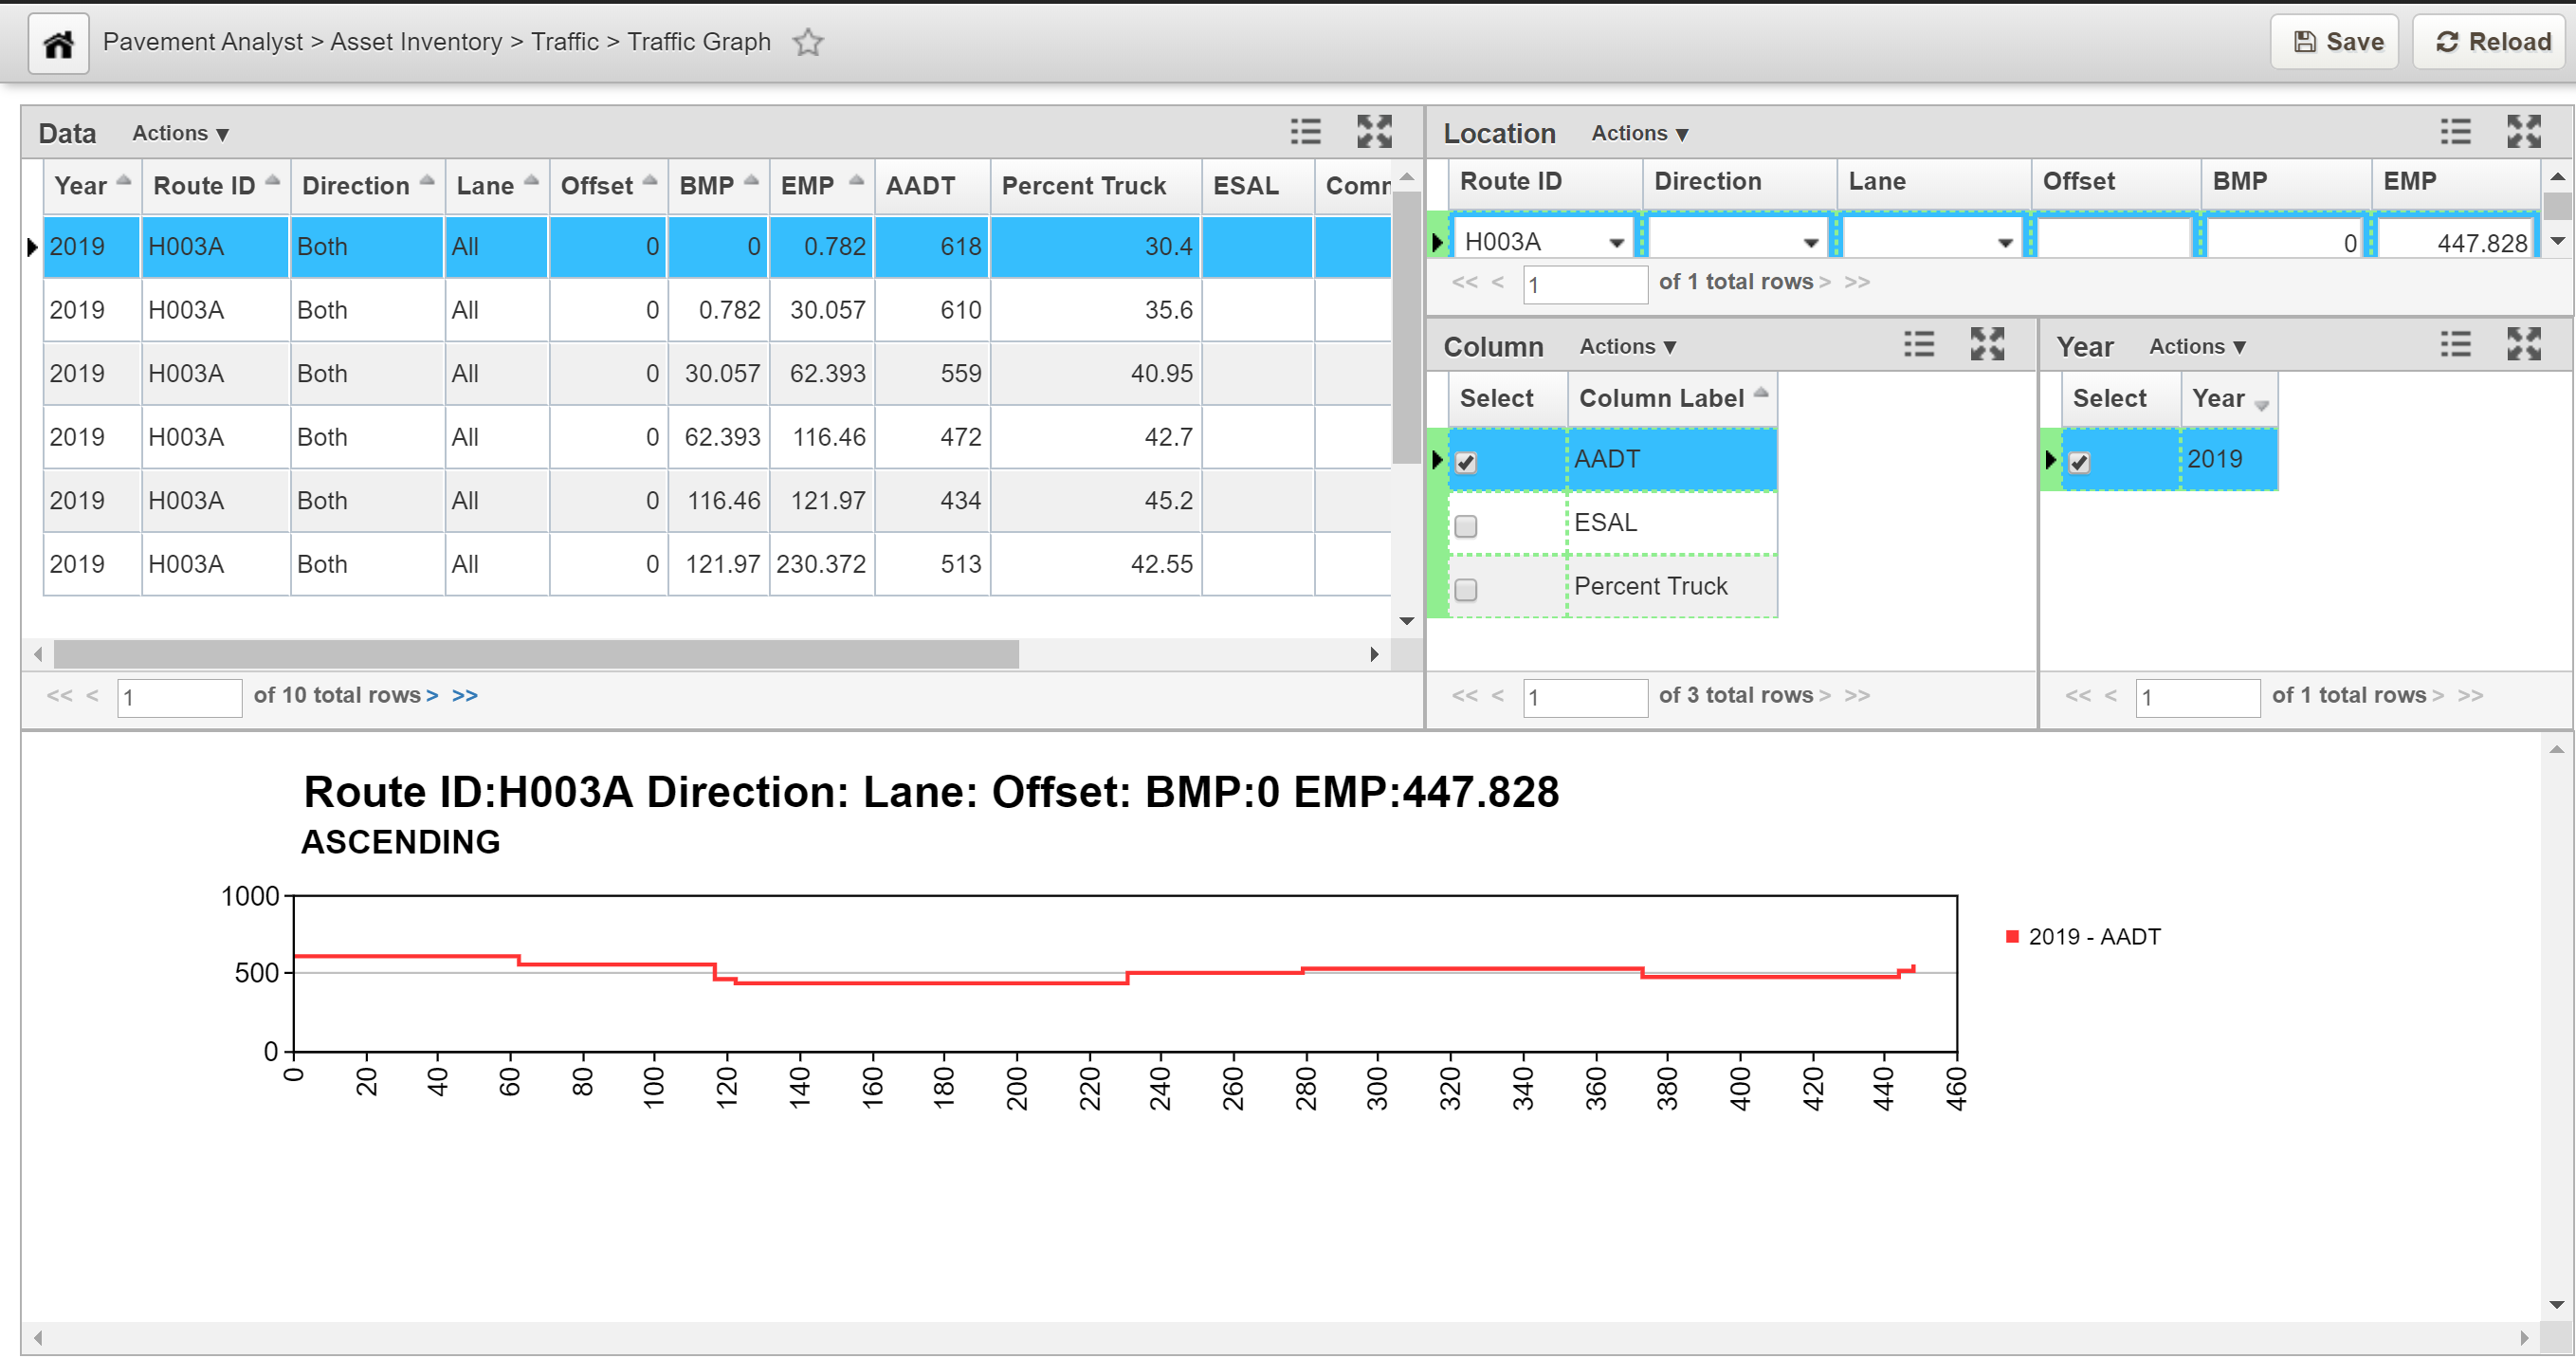
Graph View of Location based Attributes Data
The Graph View shows data from a section data table (such as traffic) along a particular road section.
The window used for the Graph View contains the following elements:
- Location pane: It shows the available routes in a drop-down list. If you right-click this pane or select the Actions menu, a shortcut menu appears with the following commands:
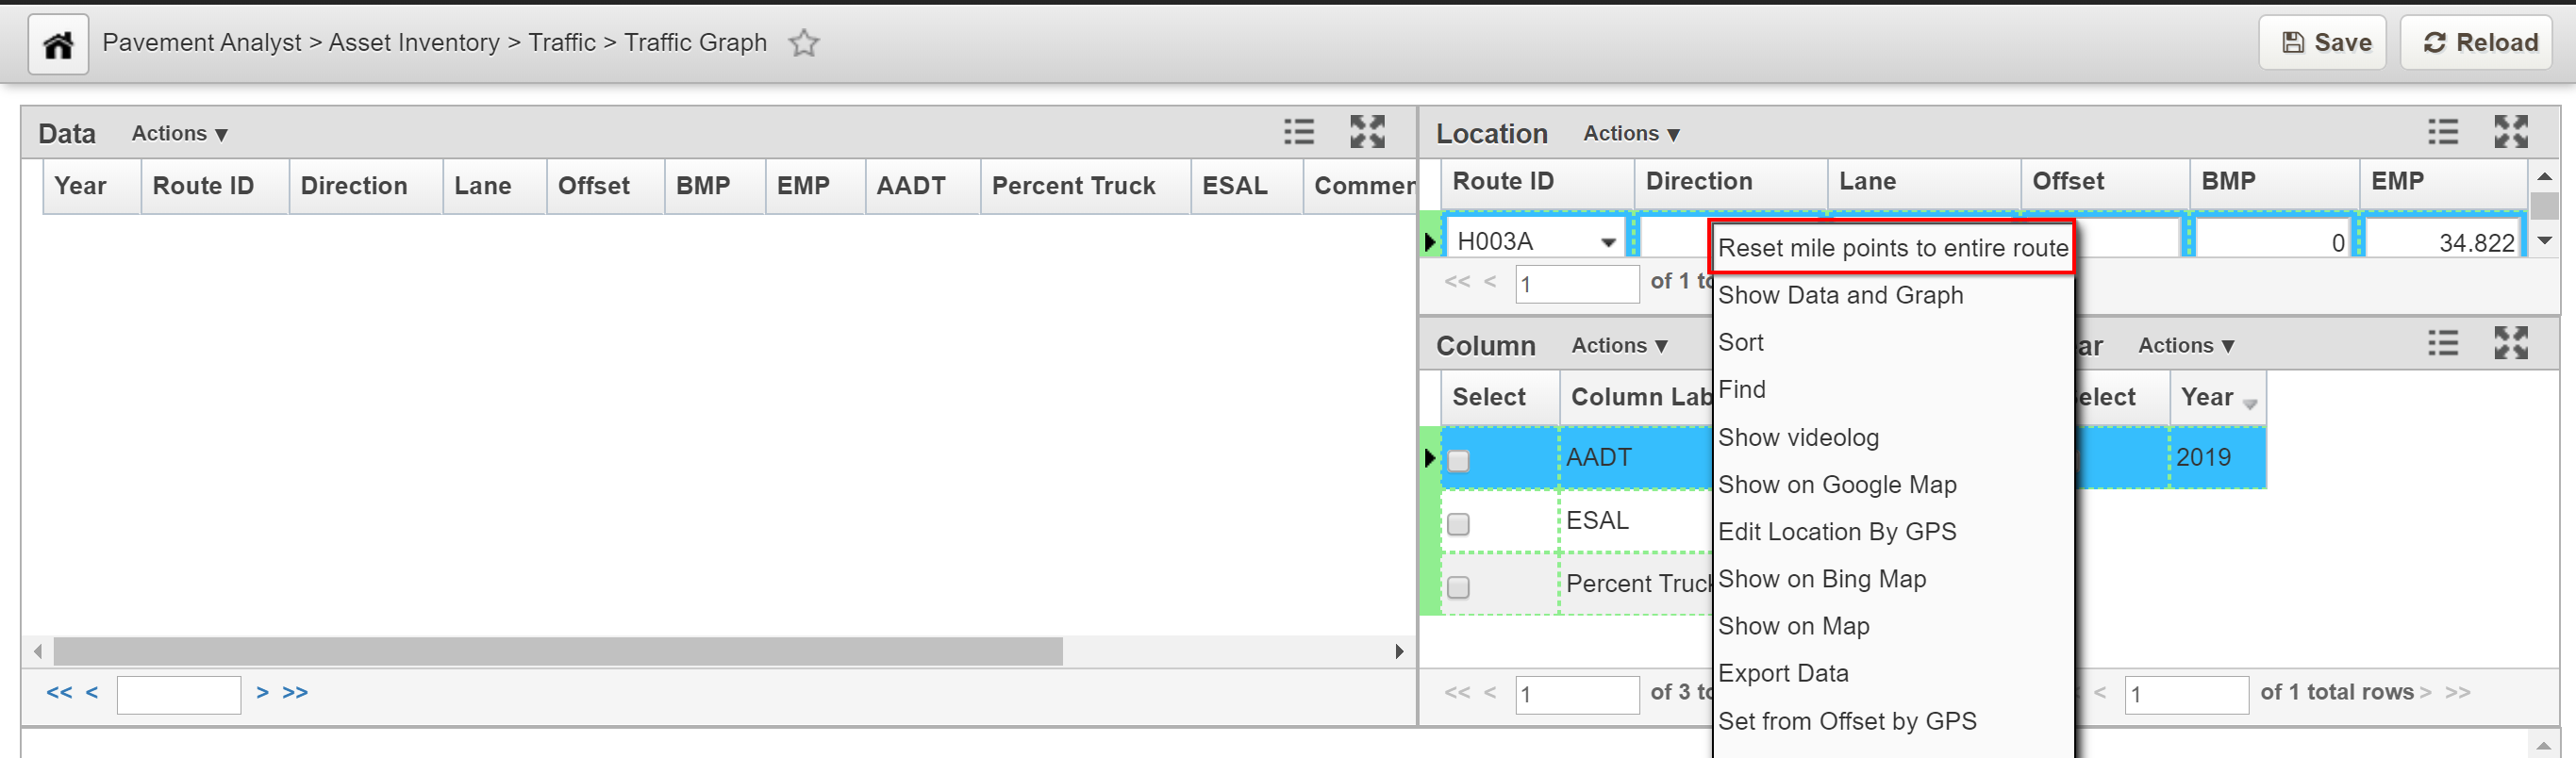
- Reset Mile Points to Entire Route: This command sets the Start and End mile points to be the entire route within the user-entered route attributes.
- Show Data and Graph: This command displays the graph in the lower pane as well as data in the Data pane.
- Measure/Index pane: Use this pane to select the data to be displayed on the graph.
- Year pane: Use this pane to select the years for data displayed on the graph.
- Data pane: It lists distress or traffic data for data collection sections limits. Before any selections are made, this pane is blank.
- Graph pane: This pane is located at the bottom of the window. It displays a curve for each combination of index and year selected in the Measure/Index and Year panes for the route selected in the Route pane. (For example, if you selected two distress indices and three years, the Graph pane would show six curves.) Before any selections are made, this pane is blank. If would like to change how the graph displays, right-click select the Actions menu and select Change Graph Properties.
The objective of this lesson is for the participant to understand how to access to the Traffic Graph window and review existing data. At the end of this lesson, the user should be able to open the Roadway Inventory window and view graphical data. |
|---|
In this example, we open the Traffic Graph window and select a record to display its data and graphical details by following the steps below:
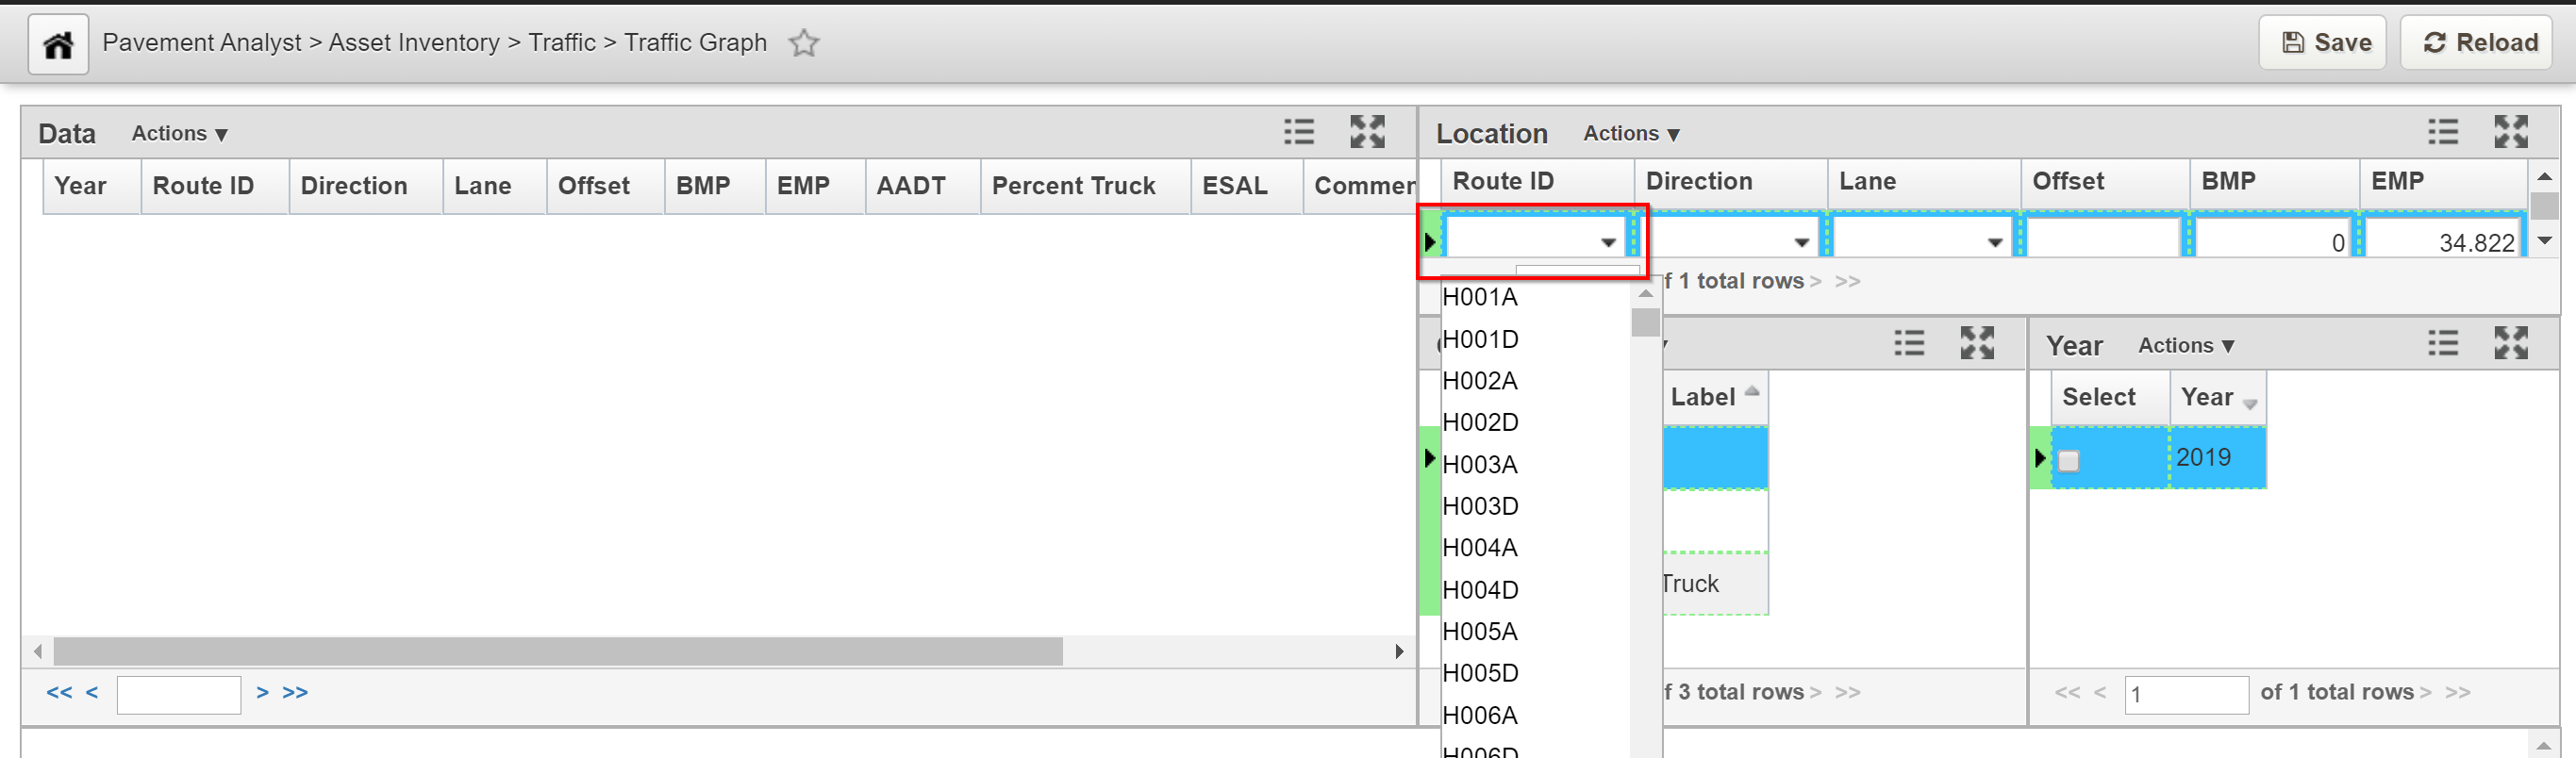
- In the Pavement module, navigate to: Pavement Analyst > Asset Inventory > Traffic > Traffic Graph
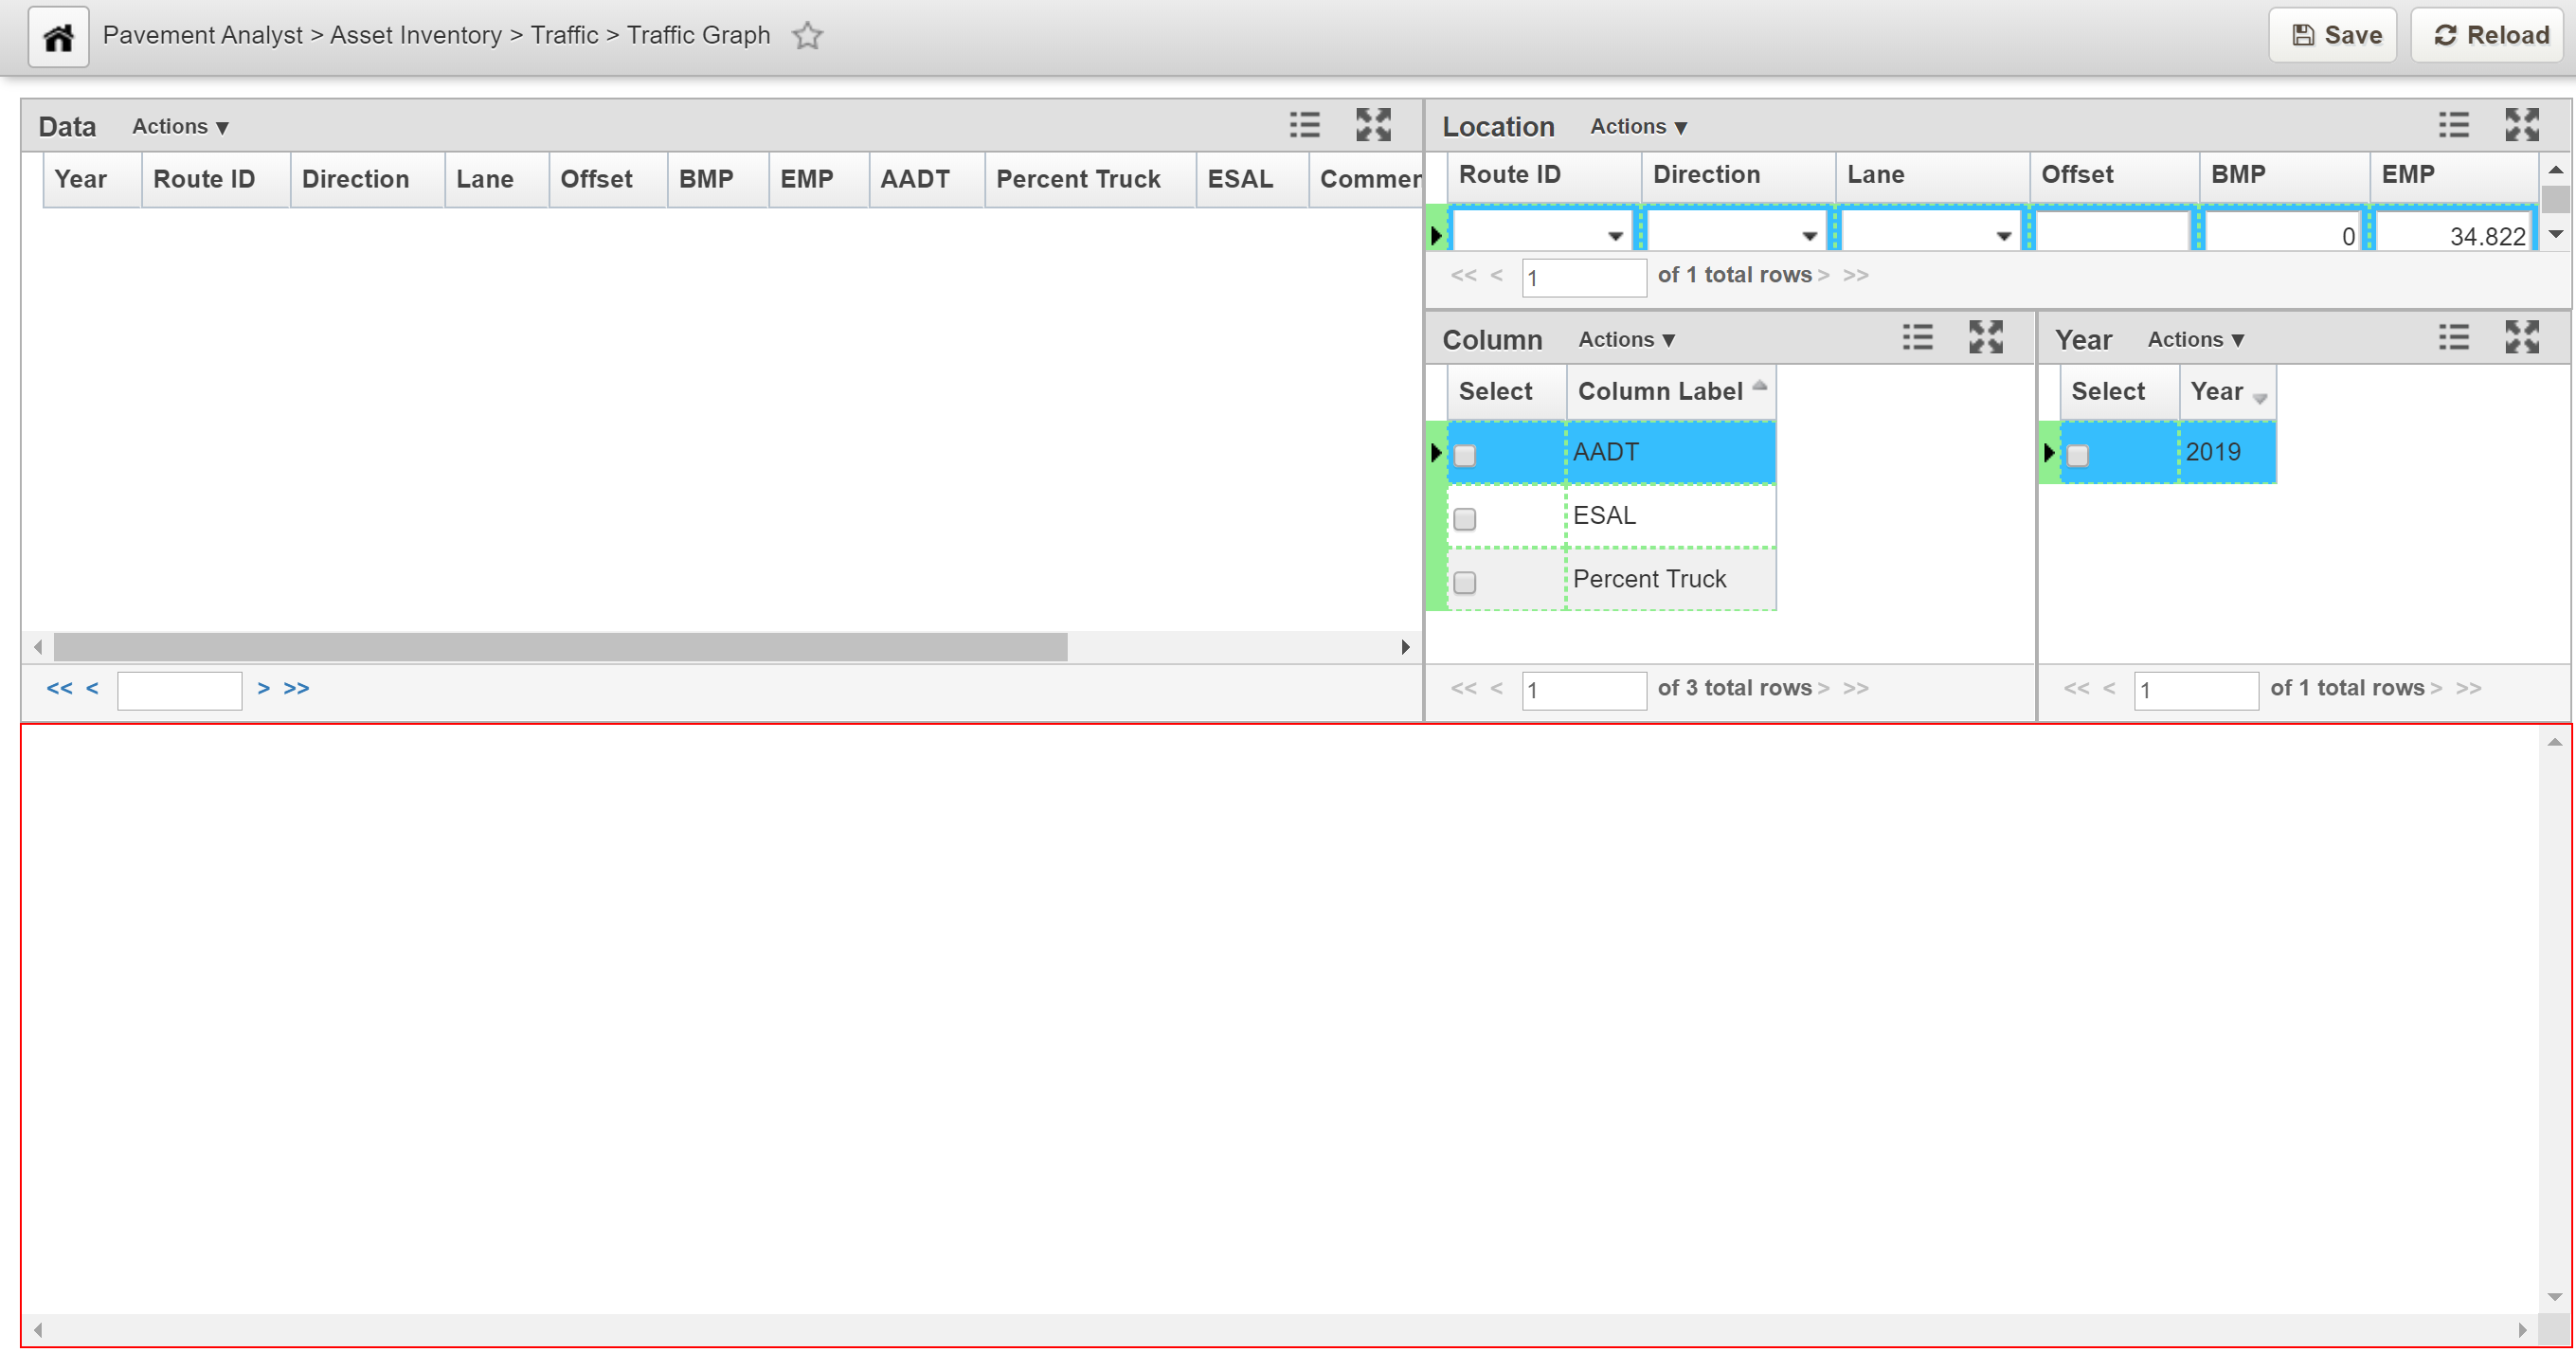
- Click the Route drop-down and choose a route of interest
- Right-click on the row and select Reset mile points to entire route. The system populates the Begin Mile and End Mile columns
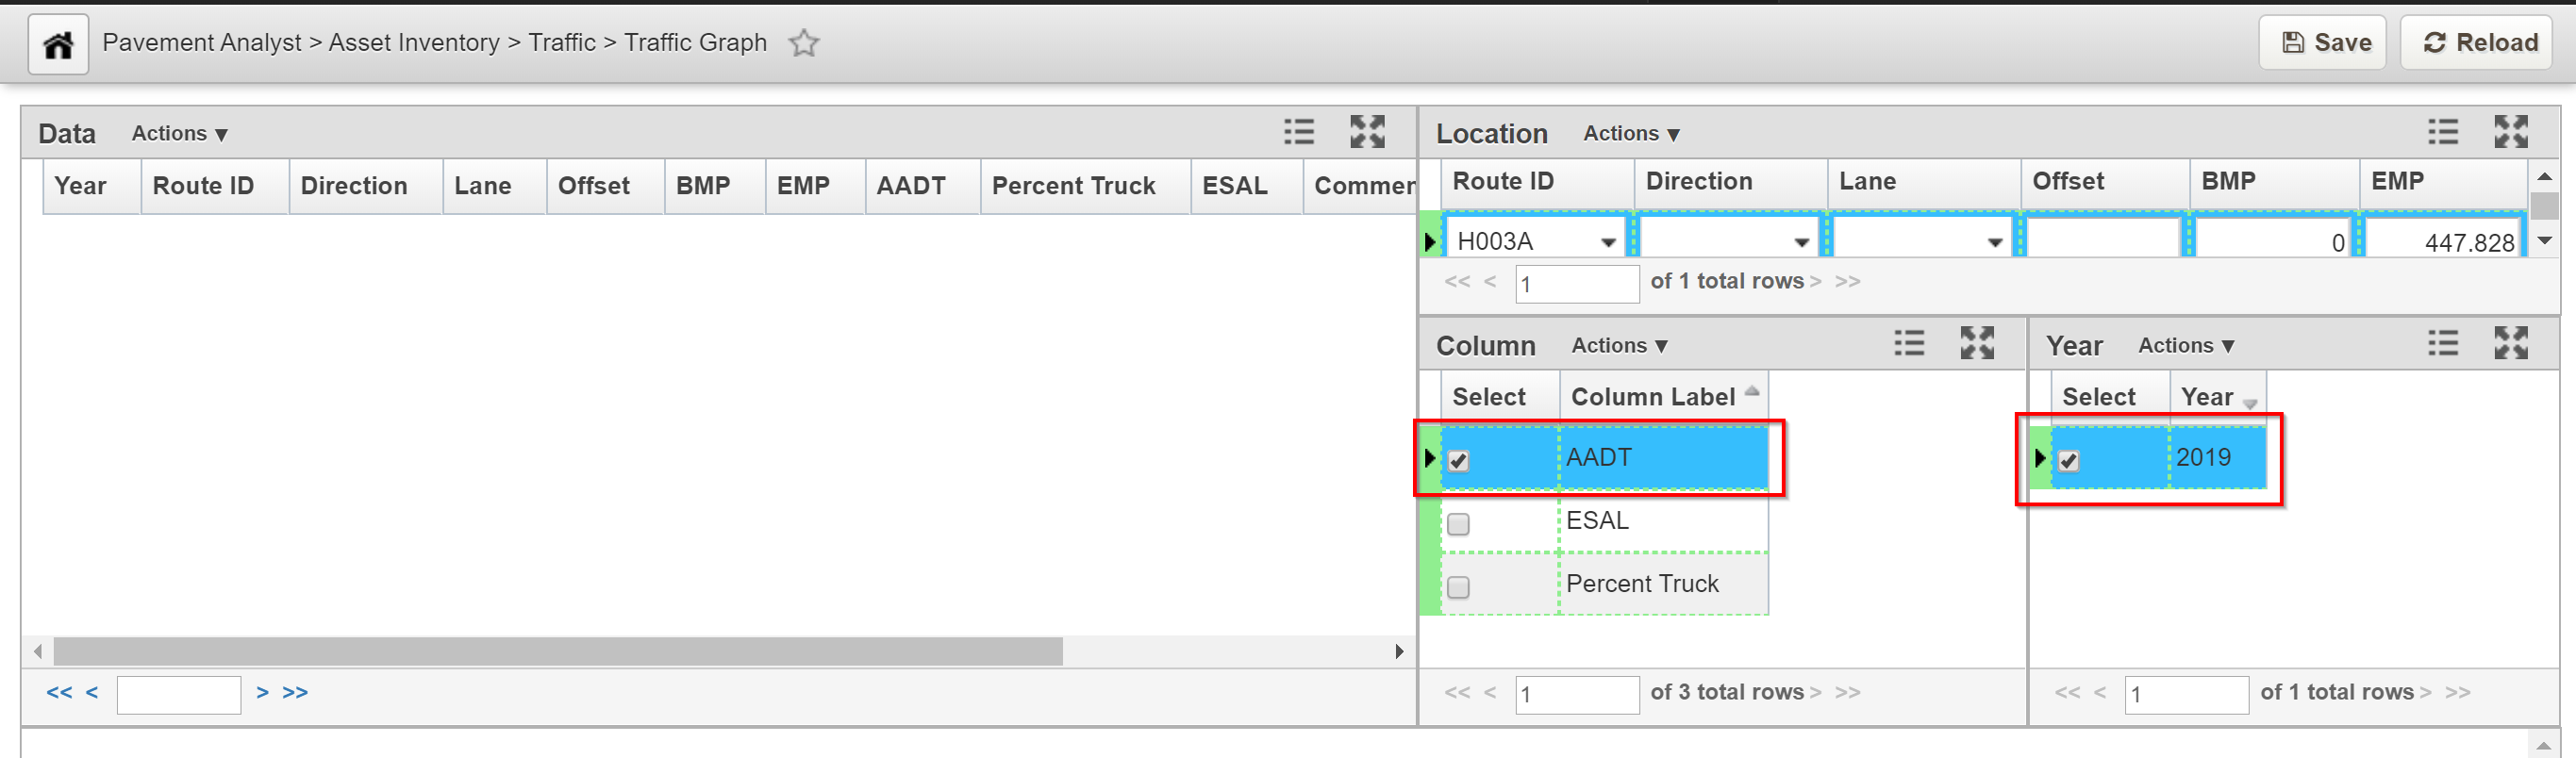
- In the Column pane, Choose the Column Label by clicking the check-box adjacent to the label of interest
- In the Year pane, choose the Year by clicking the check-box adjacent to the year of interest
- Right-click in the Location pane again and select Show Data and Graph.
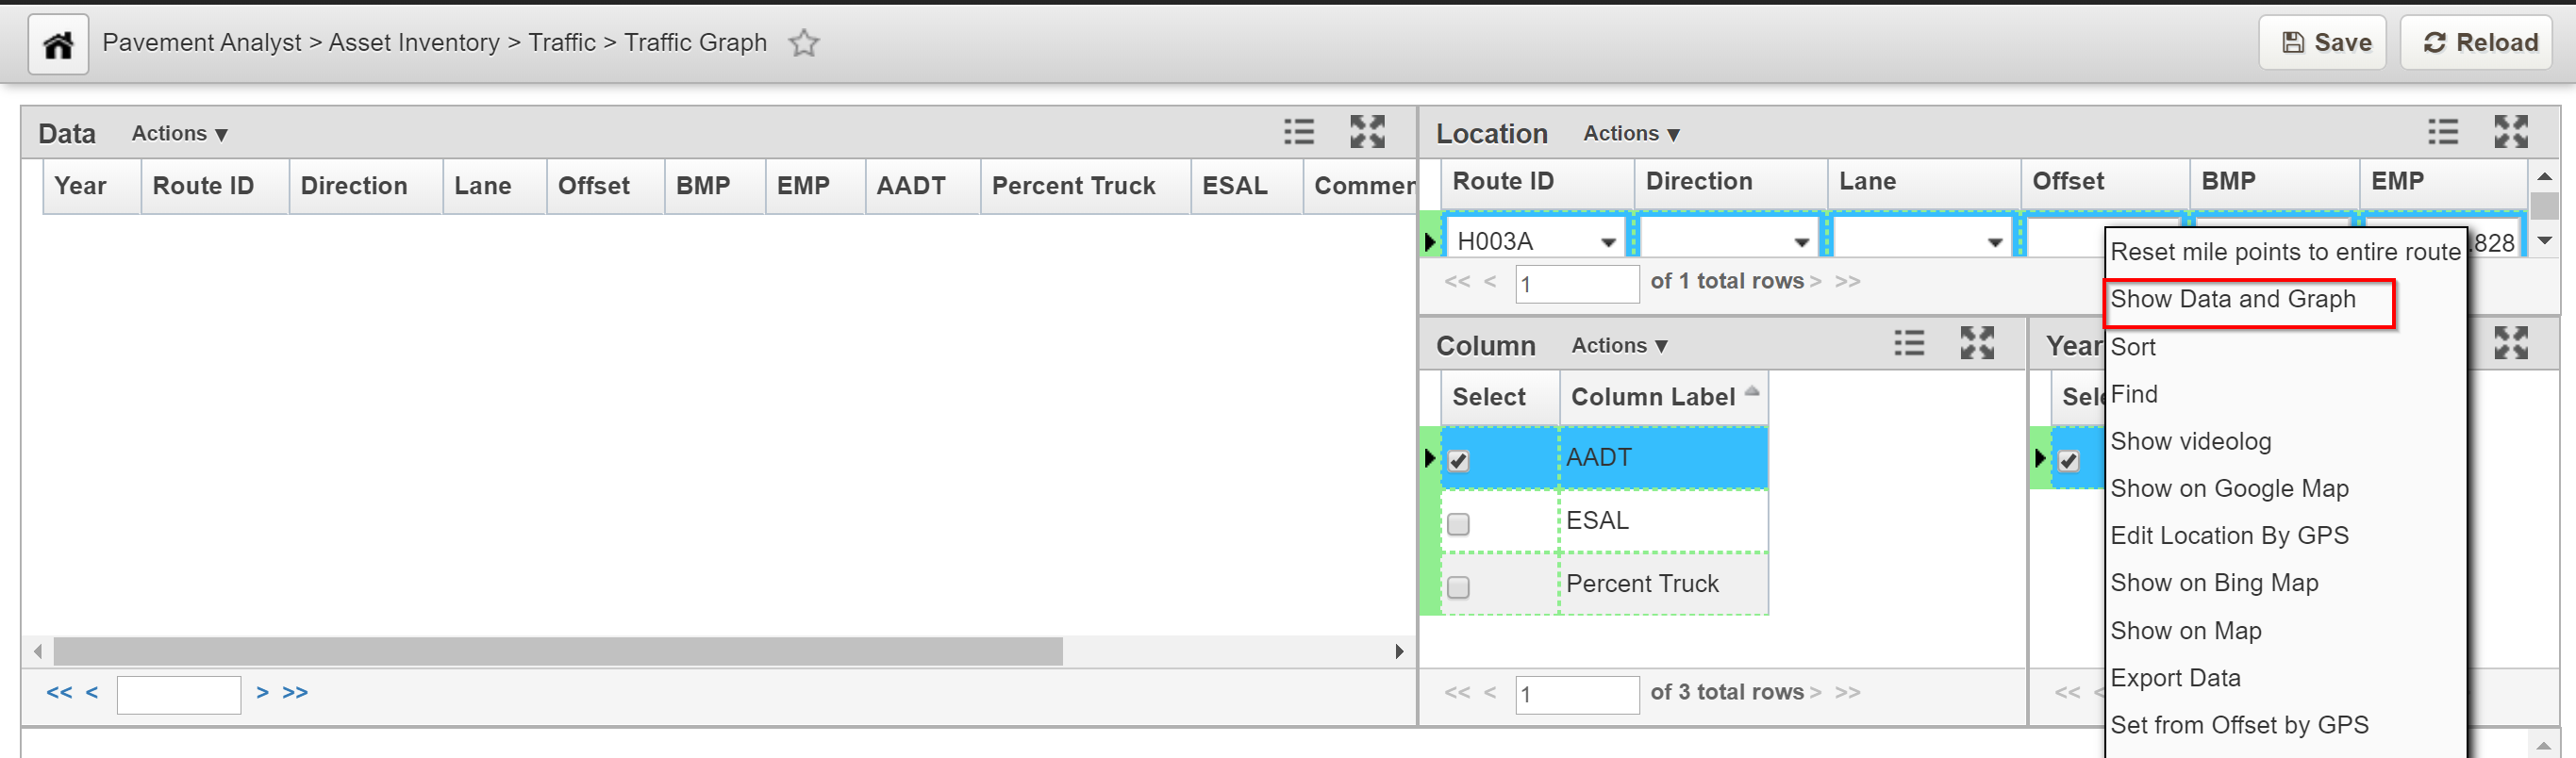
- The system generates and displays the data based on the selection that were made