The Pavement Structure feature shows changes in the construction history along a route or portion of a route. Although the window for viewing contracts is useful for reviewing individual pavement paving projects, it is not a convenient way to review the entire construction history of the roadway across multiple contracts. AgileAssets developed the Pavement Structure feature to provide "one look" access to the entire history of construction activity
Pavement Longitudinal Profile & Cross-Section Graph window
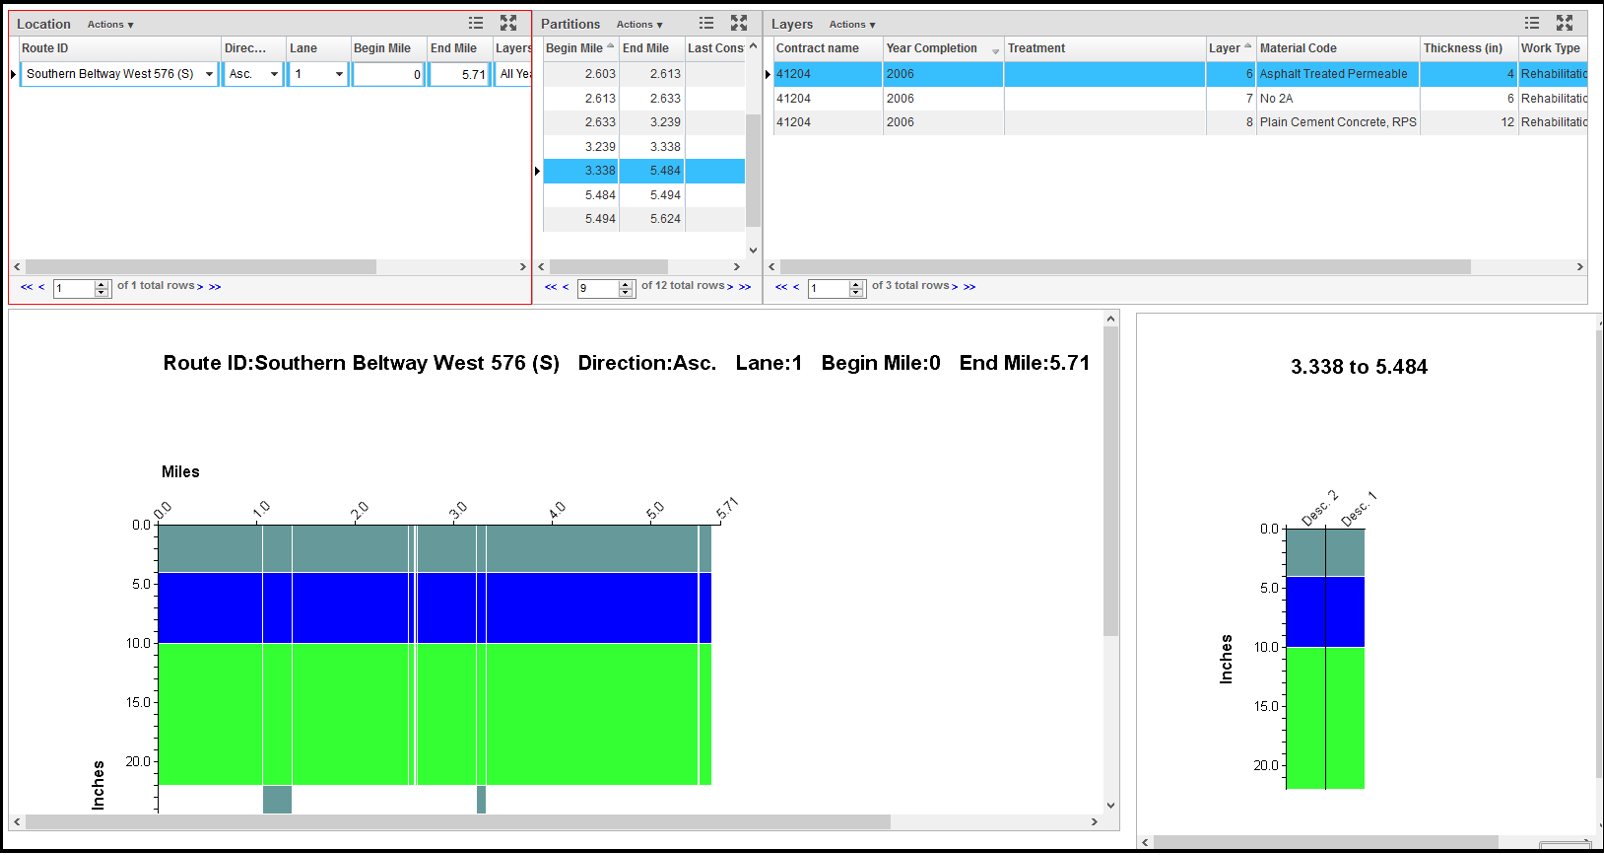
The Pavement Profile/Cross-section window shows changes in the construction history along a route or portion of a route.
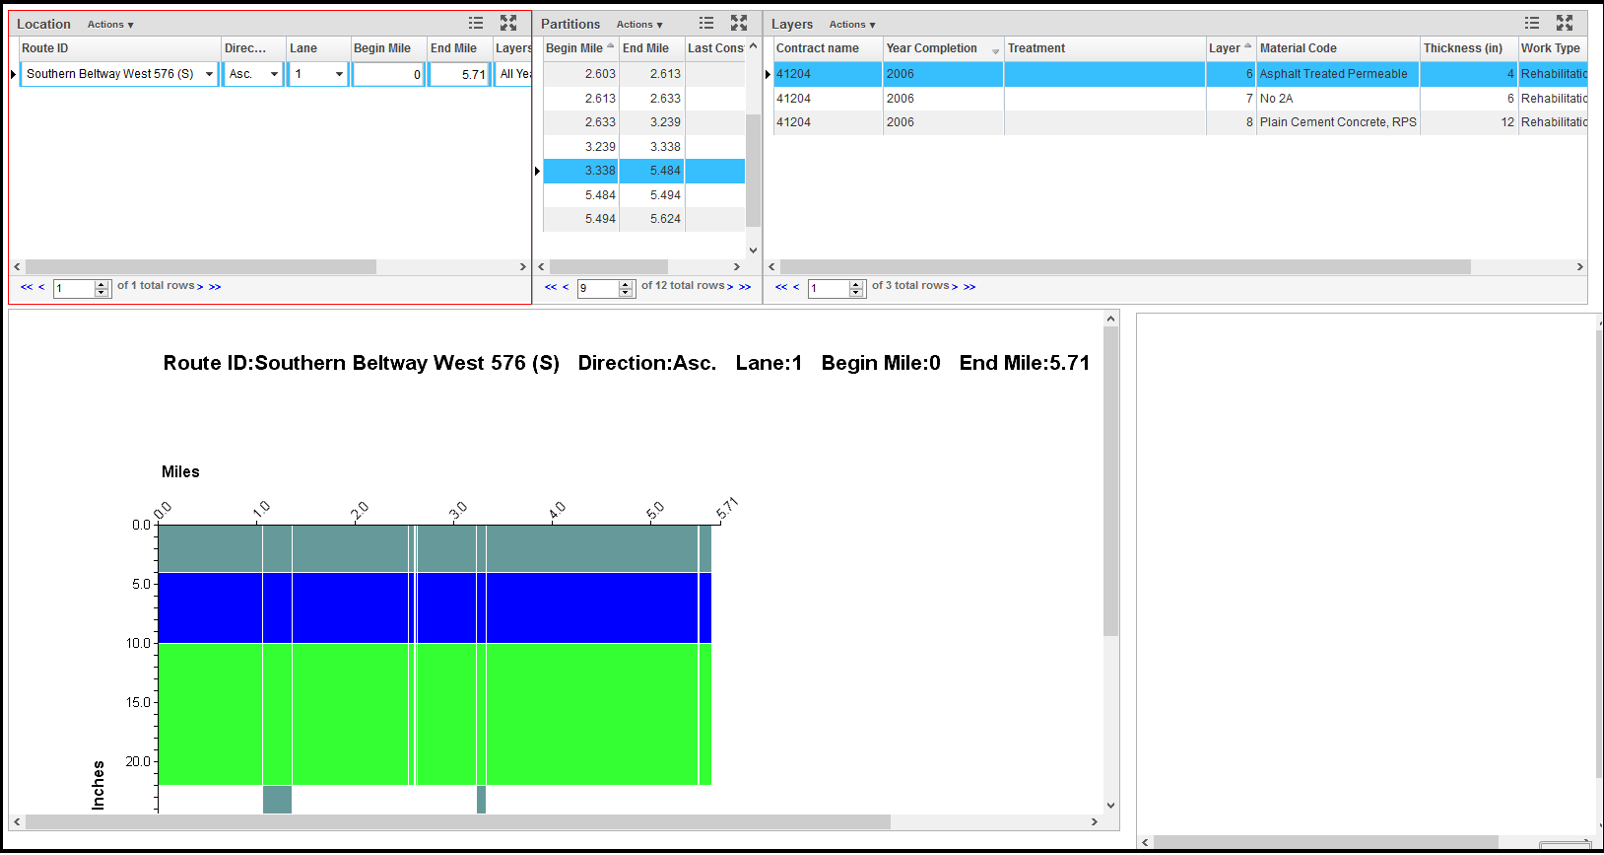
- The Location pane in the upper left corner of the Pavement Profile/Cross-section window shows the route, and section of the route, to be graphed.
- The read-only Partitions pane in the top middle of the Pavement Profile/Cross-section window displays all section limits for data displayed in the graph. These section limit breaks are a combination of all construction history between the two graph points. They are represented by vertical white lines in the graph.
- The read-only Layer pane in the upper right corner of the Pavement Profile/Cross-section window shows the construction history at a particular point on the road. This point is set in either of the following ways:
- When you click a mile point in the Section Profile graph, the Layers pane will show all layers and contracts associated with that point. In addition, the Cross-section graph on the right and the Partitions pane in the top middle will be set to that road point.
- When you adjust the Partitions pane to another section, this identifies a section of road for which all road points have identical construction history. The Layers pane then shows all layers and contracts associated with any of those points. - The bottom of this window will display a "Section Profile (Longitudinal)" graph after clicking the icon. When you click the "Section Profile (Longitudinal)" graph, a "Cross-section" graph will be displayed on the right for the road section on which you clicked.
- The Section Profile graph shows detailed construction information for the roadway specified in the Locations pane from the year given in the Show Layers Since column to the present.
You can change the vertical and horizontal scales for the graph to better display layer information. You accomplish this by right-clicking the graph and selecting the Change Graph Properties command on the shortcut menu. - When you click a mile point in the Section Profile graph, the system displays the cross-section profile at that mile point in the Cross-section graph on the right side of the window. (When the graph is first displayed in the Section Profile pane, the Cross-section graph will not be shown; select a mile point to see the graph.)
You can change the vertical and horizontal scales for the graph to better display layer information. You accomplish this by right-clicking the graph and selecting the Change Graph Properties command on the shortcut menu
Display a Section Profile Graph
Click Here for Traffic Data Exercises
The objective of this lesson is for the participant to understand how to display a Section Profile Graph data. At the end of this lesson, the user should be able to view any record in the Pavement Structure Profile / Cross Section window. |
|---|
In this example, we display a Section Profile graph by performing the following steps:
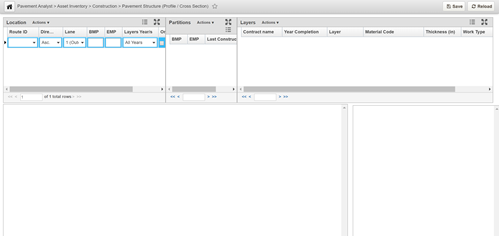
- Open the Pavement Profile /Cross-section window: Pavement Analyst > Pavement Inventory > Construction > Pavement Structure Profile / Cross Section
- In the Locations pane, click the down arrow and select the desired route from the list
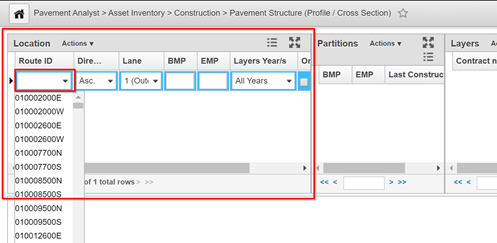
- If the route is subdivided by direction, click the down arrow in the Direction column and select the desired direction
- If the route is subdivided by lane, click the down arrow in the Lane column and select the desired lane
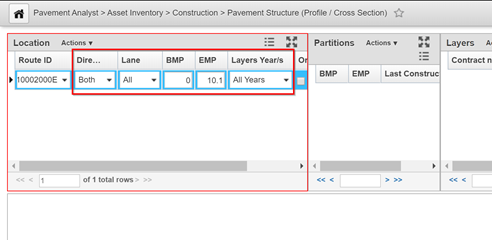
- Click in the BMP (Beginning Milepoint) column and type the starting mile point of the route to be graphed
- Click in the EMP (End Milepoint) column and type the ending mile point of the route to be graphed
Click the down arrow in the Layers Years column to display the drop-down and select the starting year for the construction history information that is to be graphed
 Note: You can also set these points by right-clicking and selecting Reset Mile Points to the Entire route instead of entering beginning and ending mile points.
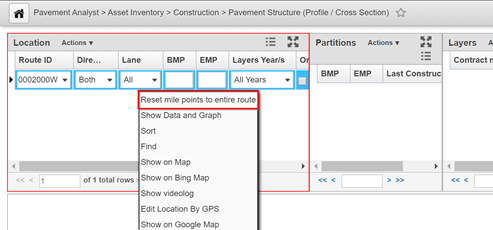
- Right-click in the Location pane and select Show Data and Graph
Display a Section Profile Cross-Section
The objective of this lesson is for the participant to understand how to display a Section Profile Cross-Section data. At the end of this lesson, the user should be able to show a Section Profile Cross-Section graph. |
|---|
In this example, we display a Cross-section graph by following the steps below:
- Open the Pavement Profile/Cross-section window
- Display the Section Profile graph for the roadway for which you wish to see the cross-section
- Locate the mile point in the Section Profile graph for which you wish to see the cross-section and select the graph at this point. The system will then display the cross-section at this mile point on the right side of the window