For more detailed information, see the following topics:
Overview of Performance Modeling
Performance modeling is absolutely essential for good management practice on everything from the project level to the network level. The BMS contains default performance models that were provided using historical data and input from your agency. You may use your engineering judgment and experience to modify these models and/or create new performance models that define the expected performance curves for a structural element. The models can be specified by structure material, by structure design, or by any other criteria that you define for grouping the structural elements on the basis of their performance. Once models are specified for all possible groupings, each model can be reviewed individually and adjusted as necessary.
Once performance models are added to the performance models library and assigned to a structural element based on the criteria identified for grouping the structural elements, you may view the predicted performance of the structural element graphically (with the assumption that no treatments were performed on the element).
Performance models may be broadly divided into two categories: group models and structure (or structural element) specific models. A group-based model is one where performance is predicted for a set of structures that have been grouped based on one or more variables. These variables are called performance classes.
For example, let’s imagine that a structural element’s material and AADT (of the structure to which the element belongs) are selected as performance classes. Material type is divided into two levels (concrete and steel), while AADT is divided into three levels (light, medium, and heavy). This means that there are a total of 6 groups (concrete – AADT light, concrete - AADT medium, steel - AADT heavy, etc.) in which the structures in your network will get divided for performance modeling.
Predicting the performance of a structure or one of its elements can be imprecise for any of the following reasons:
- There are uncertainties in a structure’s/structure element's behavior under changeable traffic load, environment, etc.
- It is difficult to systematically quantify the many factors affecting performance of the structure and its elements
- The nature of the subjective condition surveys introduces errors in the data
The system produces a wide range of deterministic models for groups of similar structures components and probabilistic models for the structural elements. The software is highly flexible in terms of allowing these models to be developed.
Performance models for Bridge Components
Types of Models Supported by Agile Bridge Manager
The table below shows the model forms used for models. Seven forms are available. You can calculate and select from each of the regression equations to choose the best model.
Model Type | Model Form | Description |
|---|---|---|
Linear | y = a + bx | The rate of deterioration of the pavement condition is the same from year to year. |
Exponential | y = a + becx | The condition remains nearly constant for a number of years, and then rapidly deteriorates. |
Inverse Exponential | y = a + becx | The condition remains nearly constant for a number of years, and then rapidly deteriorates. |
Hyperbolic | y = a + 1 / (b + cx) | The condition deteriorates steadily with the greatest rate of deterioration occurring in the early years. |
Piecewise Linear | y = ai + bix (with intersection at the end points) | You specify up to six coordinates, and the system draws a straight line between each coordinate. This type allows you to specify points in time where the deterioration rate "jumps" to a new value, where it again remains constant until the next discontinuity. |
Power | y = a + bxc | This type of model is a special form of the exponential type. Like an exponential-type graph, the pavement condition remains nearly constant for a large number of years, and then rapidly deteriorates. However, the rate of deterioration is based directly on time rather than a logarithm. |
Sigmoidal | y = a + be(-c/x)^d | The condition remains nearly constant for a number of years, then rapidly deteriorates, and then remains nearly constant again. |
Where y = condition attribute being predicted, x = age (years), and a, b, c, and d = regression coefficients.
Performance Modeling Configuration
Several data elements must be configured before models can be specified:
- The level at which a structure’s performance will be modeled
- A set of Performance Indices must be defined
- A set of Performance Classes (Factors) must be defined
- A set of Structure Element Categories must be established based on the performance classes and the level of each performance class
The performance models in your version of the BMS were developed based on the following specifications provided by your agency:
- A structure’s performance modeling will be done at the element level
- Three elements will be modeled: Deck, Superstructure, and Substructure
- The following performance indices are used to measure the condition of these structural elements. These performance indices are modeled on a 0 – 9 scale as per NBI specifications.
- Deck condition rating (for deck)
- Superstructure condition rating (for superstructure)
- Substructure condition rating (for substructure).
The performance classes (factors) or variables that are used to define the homogeneous sets of structural elements are the following: Material type, ADT, Structure Type, Bridge System, and Location
Note: Homogeneity in this case means that for performance class levels where structures/ elements are in the same category, they perform in a similar manner and provide more uniform data for performance models.Based on the performance classes (factors) and the levels associated with each class (factor level), a set of categories is established for each structural element as shown in the table below which summarizes the variables used during BMS implementation for your agency. The performance classes that were created correspond to the variables and values found in this table.
Exercise caution when choosing a performance class variable for modeling. When the number of performance classes is increased, the number of models that must be maintained increases exponentially. When selecting performance classes and defining their levels, keep in mind that the total number of models required by the system is a result of the number of performance classes multiplied times the number of levels associated with each performance class so a model is required for each structural element category. Thus, if for a structural element you have five performance classes and ten levels corresponding to each performance class, you potentially could have to create or maintain 50 models for this structural element.
Structural Element (Element Performance Index) | Performance Classes | Number of Perf. Models | ||||
Material Type | ADT | Structure Type | Bridge System | Location | ||
Deck (Deck Condition Rating) | FL1: Timber | FL1: <=200 FL2: 201-800 FL3: 801-2000 FL4: 2001-4000 FL5: > 4000 | X | X | X | 5 x 3 = 15 |
FL2: Reinforced Concrete | FL1: <=200 FL2: 201-800 FL3: 801-2000 FL4: 2001-4000 FL5: > 4000 | X | X | X | ||
FL3: Steel | FL1: <=200 FL2: 201-800 FL3: 801-2000 FL4: 2001-4000 FL5: > 4000 | X | X | X | ||
Superstructure (Superstructure Condition Rating) | FL1: Timber | X | FL1: Multi-Beam | FL1: Interstate & Primary FL2: Secondary | X | 12 |
FL2: Reinforced Concrete | X | FL1: Slab FL2: Tee-Beam | FL1: Interstate & Primary FL2: Secondary | X | ||
FL3: Steel | X | FL1: Truss FL2: Floor Beam & Multi-Beam | FL1: Interstate & Primary FL2: Secondary | X | ||
FL4: Pre-stressed Concrete | X | FL1: Multi-Beam | FL1: Interstate & Primary FL2: Secondary | X | ||
Substructure (Substructure Condition Rating) | FL1: Timber | X | X | X | FL1: Coastal FL2: Piedmont FL3: Mountain | 12 |
FL2: Reinforced Concrete | X | X | X | FL1: Coastal FL2: Piedmont FL3: Mountain | ||
FL3: Steel | X | X | X | FL1: Coastal FL2: Piedmont FL3: Mountain | ||
FL4: Pre-stressed Concrete | X | X | X | FL1: Coastal FL2: Piedmont FL3: Mountain | ||
How to Review and Modify the Performance Classes and Categories
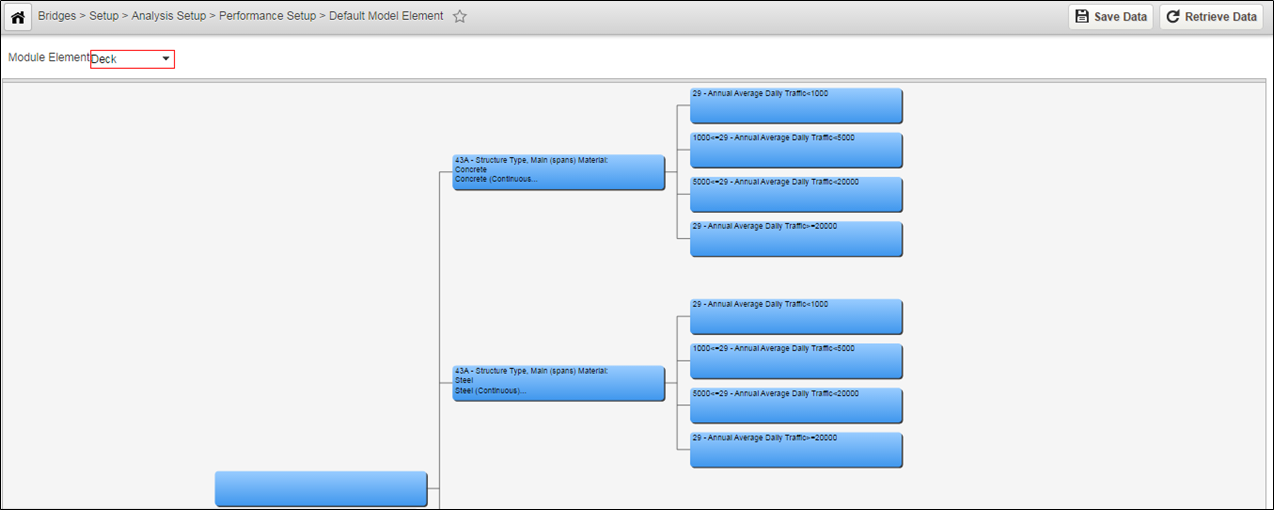
The performance class definitions and the categories for each structural element are maintained in the Default Model Element window. An example of this window is shown in the screenshot below.
The Default Model Element window provides a Module Element drop-down list at the top of the window. Once you select the structural element in the Module Element field, the system displays the performance categories associated with the structural element in a tree structure. Each node of the tree represents a performance category. Each node of the tree uses a decision variable (which is a performance class) to determine which of the subsequent branches to the right will be followed. The tree is read from left to right, with the leftmost node representing the most general and the rightmost nodes the most specific performance categories.
The performance model tree configured here is used in the Performance Models window, where a performance/deterioration model is assigned to the rightmost nodes for performance indices associated with each structural element.
To review/modify the performance classes and the corresponding categories associated with a structural element, follow the steps below:
- Display the Default Model Element window
- Select the Structures Analyst module
- Select Setup from the banner menu at the top of the page
- Select Componene Analysis
- Click Performance Model Assignment
- In the Module Element field, click the down arrow to display the list of structural elements and then click the desired element. The system responds by displaying the tree structure for the selected element. An example of a decision tree for the Deck category is shown below.
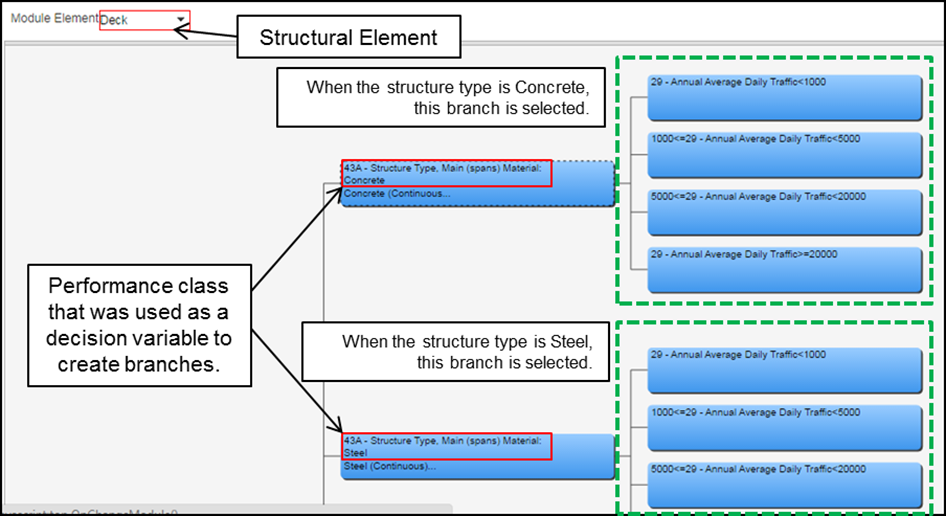
Review the performance classes associated with the selected structural element.
Note: Performance classes are used as decision variables to define a branch’s nodes (performance categories/groups).Review the performance categories represented by the various nodes of the tree.
Note: The leftmost nodes in the tree represent more general performance categories, whereas the nodes towards the right represent more specific categories (groups).- To add a performance category (group), right-click the parent node associated with the performance category node and then click Add Branch. The system displays a dialog box to allow you to enter the number of nodes to add.
- In the dialog box, enter the number of nodes that you want to add and then click the OK button to close the dialog box. The system responds by adding the specified number of nodes to the branch. You may now edit each node to set the branching criteria.
- To edit a performance category, right-click and then click Edit Decision Var Limits. The system displays the Model Tree Node window. An example of this window is shown below.
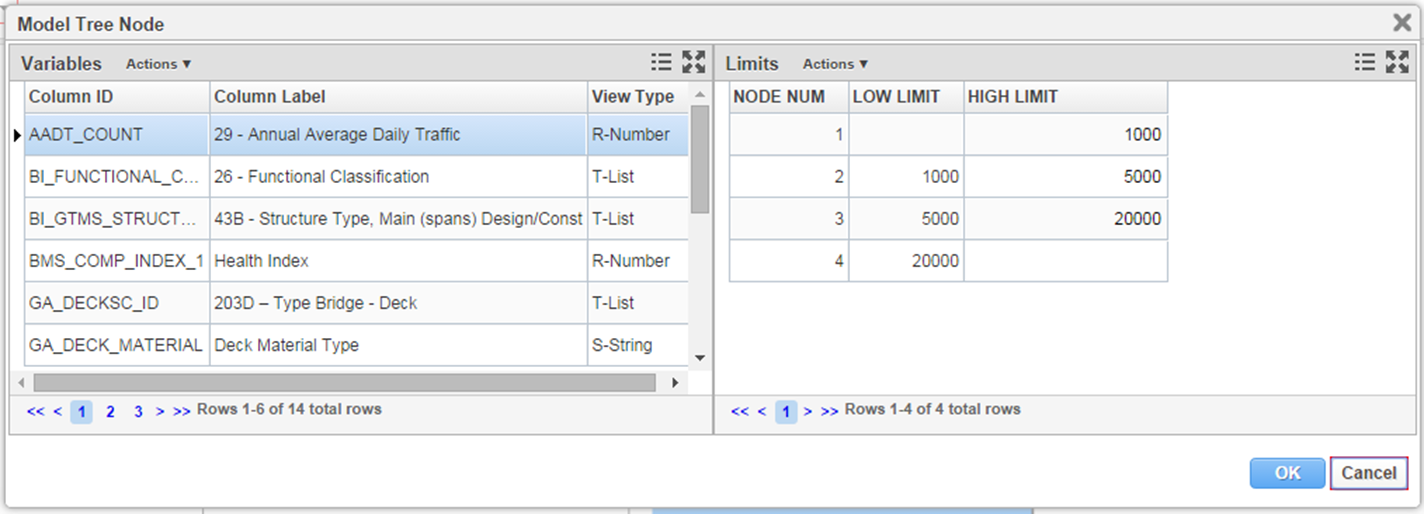
The left side of this dialog box shows the available decision variables, which essentially represent the available performance class variables. The right side of the dialog box shows the values for the decision variable selected on the left.
If the variable is configured to have character values, then the right pane shows all character values that may be assigned to the variable. You assign a node to each character value, with that node being activated when the variable equals the assigned character value. Note that not all values need to be assigned; use Node 0 for any character values you do not wish to assign. Also note that a value may be applied to more than one child node. (The nodes are numbered from the top of the window down.)
In other words, with numeric values you assign threshold values to the child nodes, while with character values you assign child nodes to the values.
- In the left pane of the Model Tree Node window, click the decision variable you wish to use
- In the right pane of the Model Tree Node window, assign the variable’s values to the child nodes
- Click OK to close the Model Tree Node window.
(To check what was assigned, hover over the parent node and the system will show the selected decision variable and branching values.) Repeat steps the steps above to modify the performance model decision tree structure as desired.
Note: For each subsequent level of the hierarchy (in the decision tree), the available decision variables decrease by one. This is because decision variables may only be used once in the hierarchy.- Click Save to save the changes.
How to Create a Model in the Performance Models Library
To create/modify/review a performance models in the performance models library, follow the steps below:
- Navigate to the BMS module
- Click Setup in the top banner menu
- Click Analysis Setup
- Click Performance Setup
- Select Models from the drop-down menu to open the Models window
An example of this window is shown below: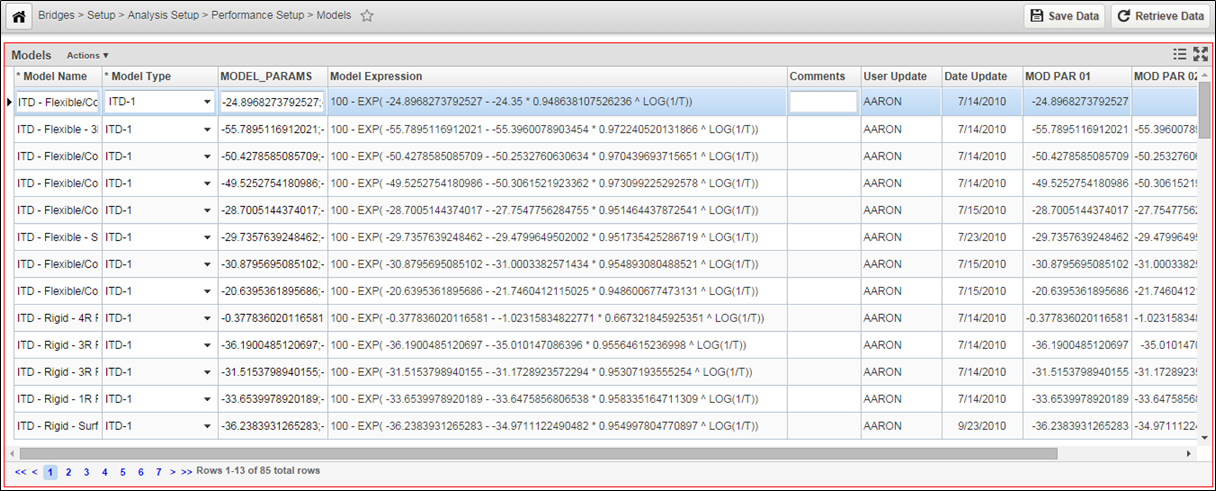
- Right-click in the Models window and then click Insert. The system adds a new record to the window.
- In the Model Name column in the new record, highlight the default name and then type a new name that describes the model.
- In the Model Type column, click the down arrow to display the list of model types and then click the desired type of model. After selecting the type of model, the system displays a dialog box for the model parameters.
Enter the model parameters (based on the model type selected) and then click the OK The system closes the dialog box.
Note: When specifying a new model, make sure that the model expression is such that the resulting performance condition, as computed from the model, is on a 100 – 0 scale. In case a specific performance index uses a different scale (for example, NBI superstructure rating is generally on a 9 - 0 scale), the corresponding upper (9, in this example) and lower (0, in this example) limits can be specified later in the Performance Models window.- Click Save to save the new model.
To edit the parameters of model that has been already specified, double-click the model expression. The system displays a text editor, which shows the model expression.
Note: You may also edit the parameters of the model by right-clicking the model and then clicking Edit Model Parameters.- In the text editor, edit the expression and then click OK.
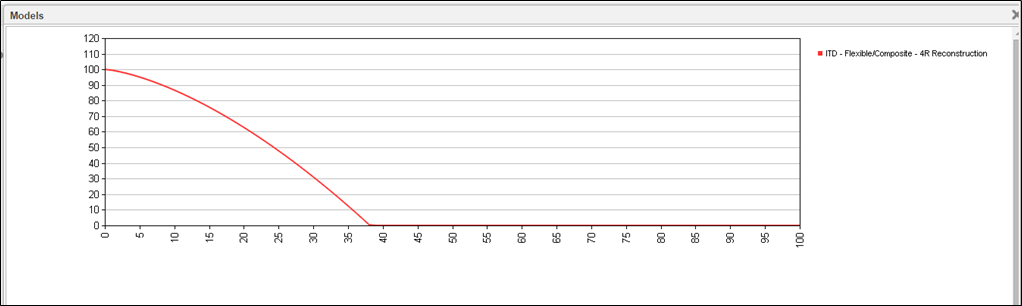
- If desired, you may view the created model graphically by right-clicking and then clicking Show Selected. The system displays a new window that shows the model as defined. An example is shown below. Click the close icon in the top right corner to close the window.
How to View the Columns That Describe the Performance of a Structural Element
To view which variable of the Network Master define the behavior of which structural element, follow these steps:
- Select the Structures Analyst module
- Select Setup from the banner menu at the top of the page
- Click Analysis Columns & Attributes to open the BMS Columns window
An example of this window is shown below: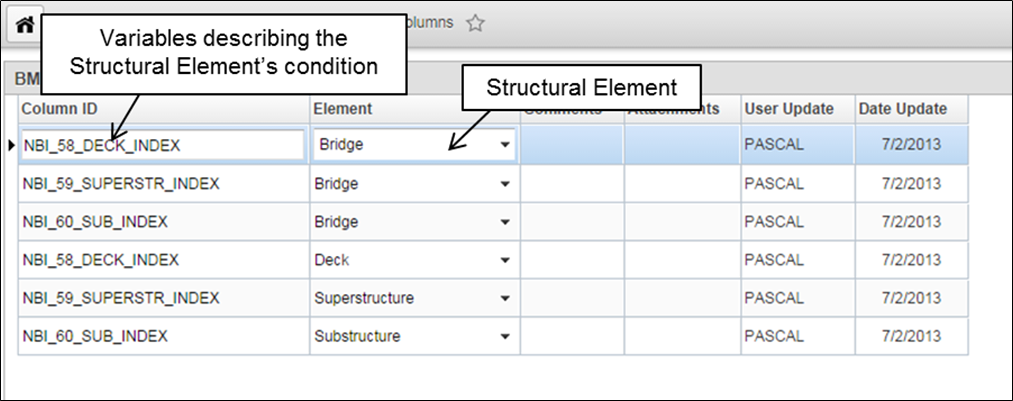
- In the window, review the variables of the Network Master that describe the condition of each element.
How to Assign Performance Models to Performance Categories
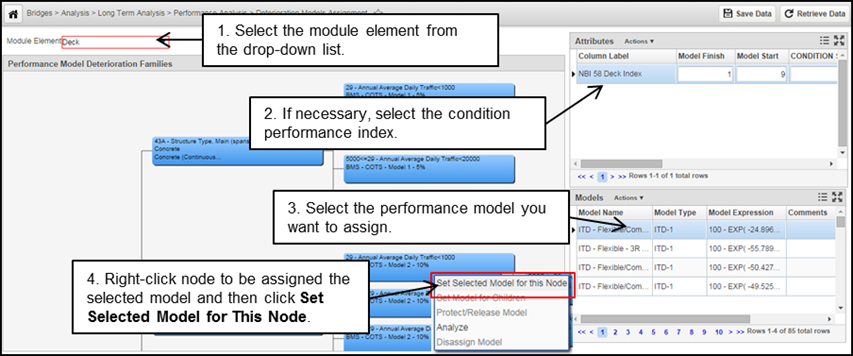
To analyze the performance of a structure using a performance model, the performance category to which the structure belongs must be assigned a performance model. You assign performance models to groups of structures or performance categories associated with a structural element in the Deterioration Models Assignment window. An example of this window is shown below:
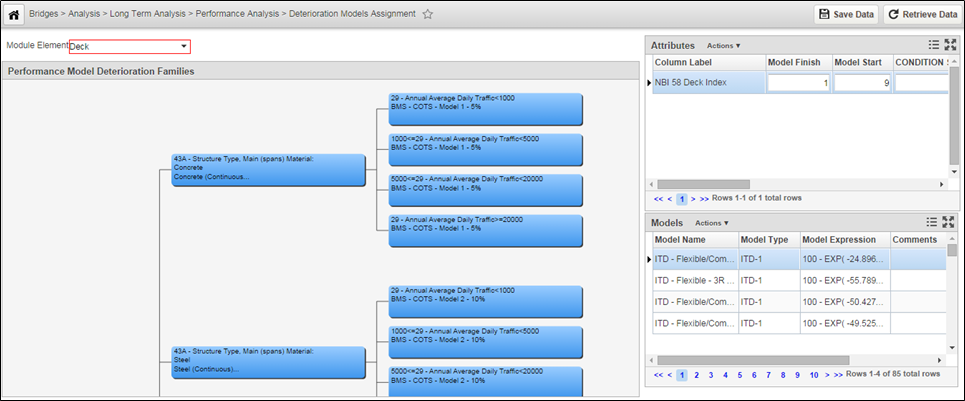
Note: As with the Models window, the size of the nodes shown in the Performance Model Deterioration Families pane may be adjusted by using the scroll wheel on your mouse to zoom in or out as desired. You may also drag the displayed tree hierarchy to new positions to view different portions of the hierarchy.
The Deterioration Models Assignment window provides a Module Element field at the top of the window and three panes: the Performance Model Deterioration Families pane, the Attributes pane, and the Models pane. These are described below:
- The Module Element field allows you to select the structural element corresponding to which models will be assigned to the performance categories
- The Attributes Pane shows all available performance indices (condition attributes) that are associated with the selected structural element (in the Module Element field)
- The Models Pane shows the list of performance/deterioration models in the library that may be assigned to any of the nodes in the performance model decision tree
Once you select the structural element, the Performance Model Deterioration Families Pane refreshes to show the performance model decision tree structure that was created in the Default Model Element window for the selected element. Each node in the decision tree structure represents the performance categories (groups) that are associated with a structural element.
Note: The structure and branching criteria of the performance model decision tree cannot be modified in the Deterioration Models Assignment window. You may only assign models may to the nodes of the decision tree (performance categories/groups) in the Deterioration Models Assignment window.
Once the models have been assigned to performance categories (groups of structures), the information is used in Scenario Analysis and in Modeling Deterioration of a Structure.
To assign a performance model to a performance category/group, follow the steps below:
- Select the Structures Analyst module
- Select Setup from the banner menu at the top of the page
- Select Componenet Analysis from the drop-down menu
- Click Performance Model Assignment to open the Deterioration Models Assignment window
- When the window opens, one node is shown in the Performance Model Deterioration Families pane
- In the Module Element field, click the down arrow to odisplay the list and then click the structural element for which you want to assign performance models
- In the Attributes pane, select (by clicking on the corresponding record) the condition performance index corresponding to which a performance model has to be assigned to each node of the decision tree
- In the Models pane, locate the model to be assigned to the first child node (corresponding to the selected attribute in the Attributes pane) and then click the row showing this model to select it.
- Right-click the first child node and then click Set Selected Model for This Node. The system displays the name of the model in the node
Repeat for the remaining child nodes, each time selecting a model from the Models pane corresponding to the selected attribute in the Attributes pane
Note: When all child nodes of a parent would utilize the same model, you may right-click the child nodes' parent node and use Set Model for Children as a shortcut to assigning the selected model to each child node. However, the parent node must have a model already assigned to it before using this command. (If no model is configured for the parent node, this command is not available.)- Repeat corresponding to all the performance indices that are associated with a structural element and are desired to follow a performance curve
- Repeat for all the structural elements for which you want to conduct deterioration analysis
- Click Save to save the changes
The assignment of performance models to performance categories (groups) of structural elements is now complete. The deterioration of all structural elements that meet the decision criteria in a branch of the hierarchy is represented by the model at the end of the branch.
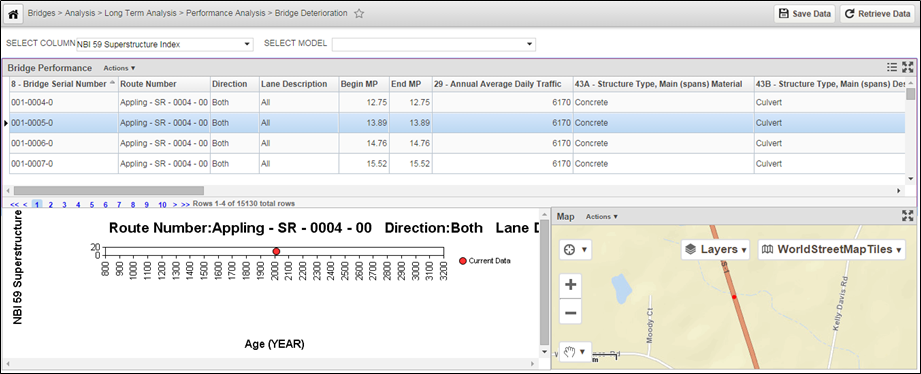
How to Analyze a Structure’s Performance Using Assigned Models
To analyze the performance of a structure and its elements using the assigned performance models, follow these steps:
- Select the Structures Analyst module
- Select Analysis in the top banner menu
- Click Performance Model Analysis to open the Bridge Deterioration window
- In the Select Column field, click the down arrow to display the list of performance indices and then click the performance index corresponding to the structural element whose performance you want to analyze
- In the Structures pane, select the structure whose performance (or whose elements performance) you want to analyze
- In the Select Model field, review the performance model that is assigned to the selected structure (based on the performance model decision tree)
- Review the performance graph of the selected performance index in the performance graph at the bottom of the window