...
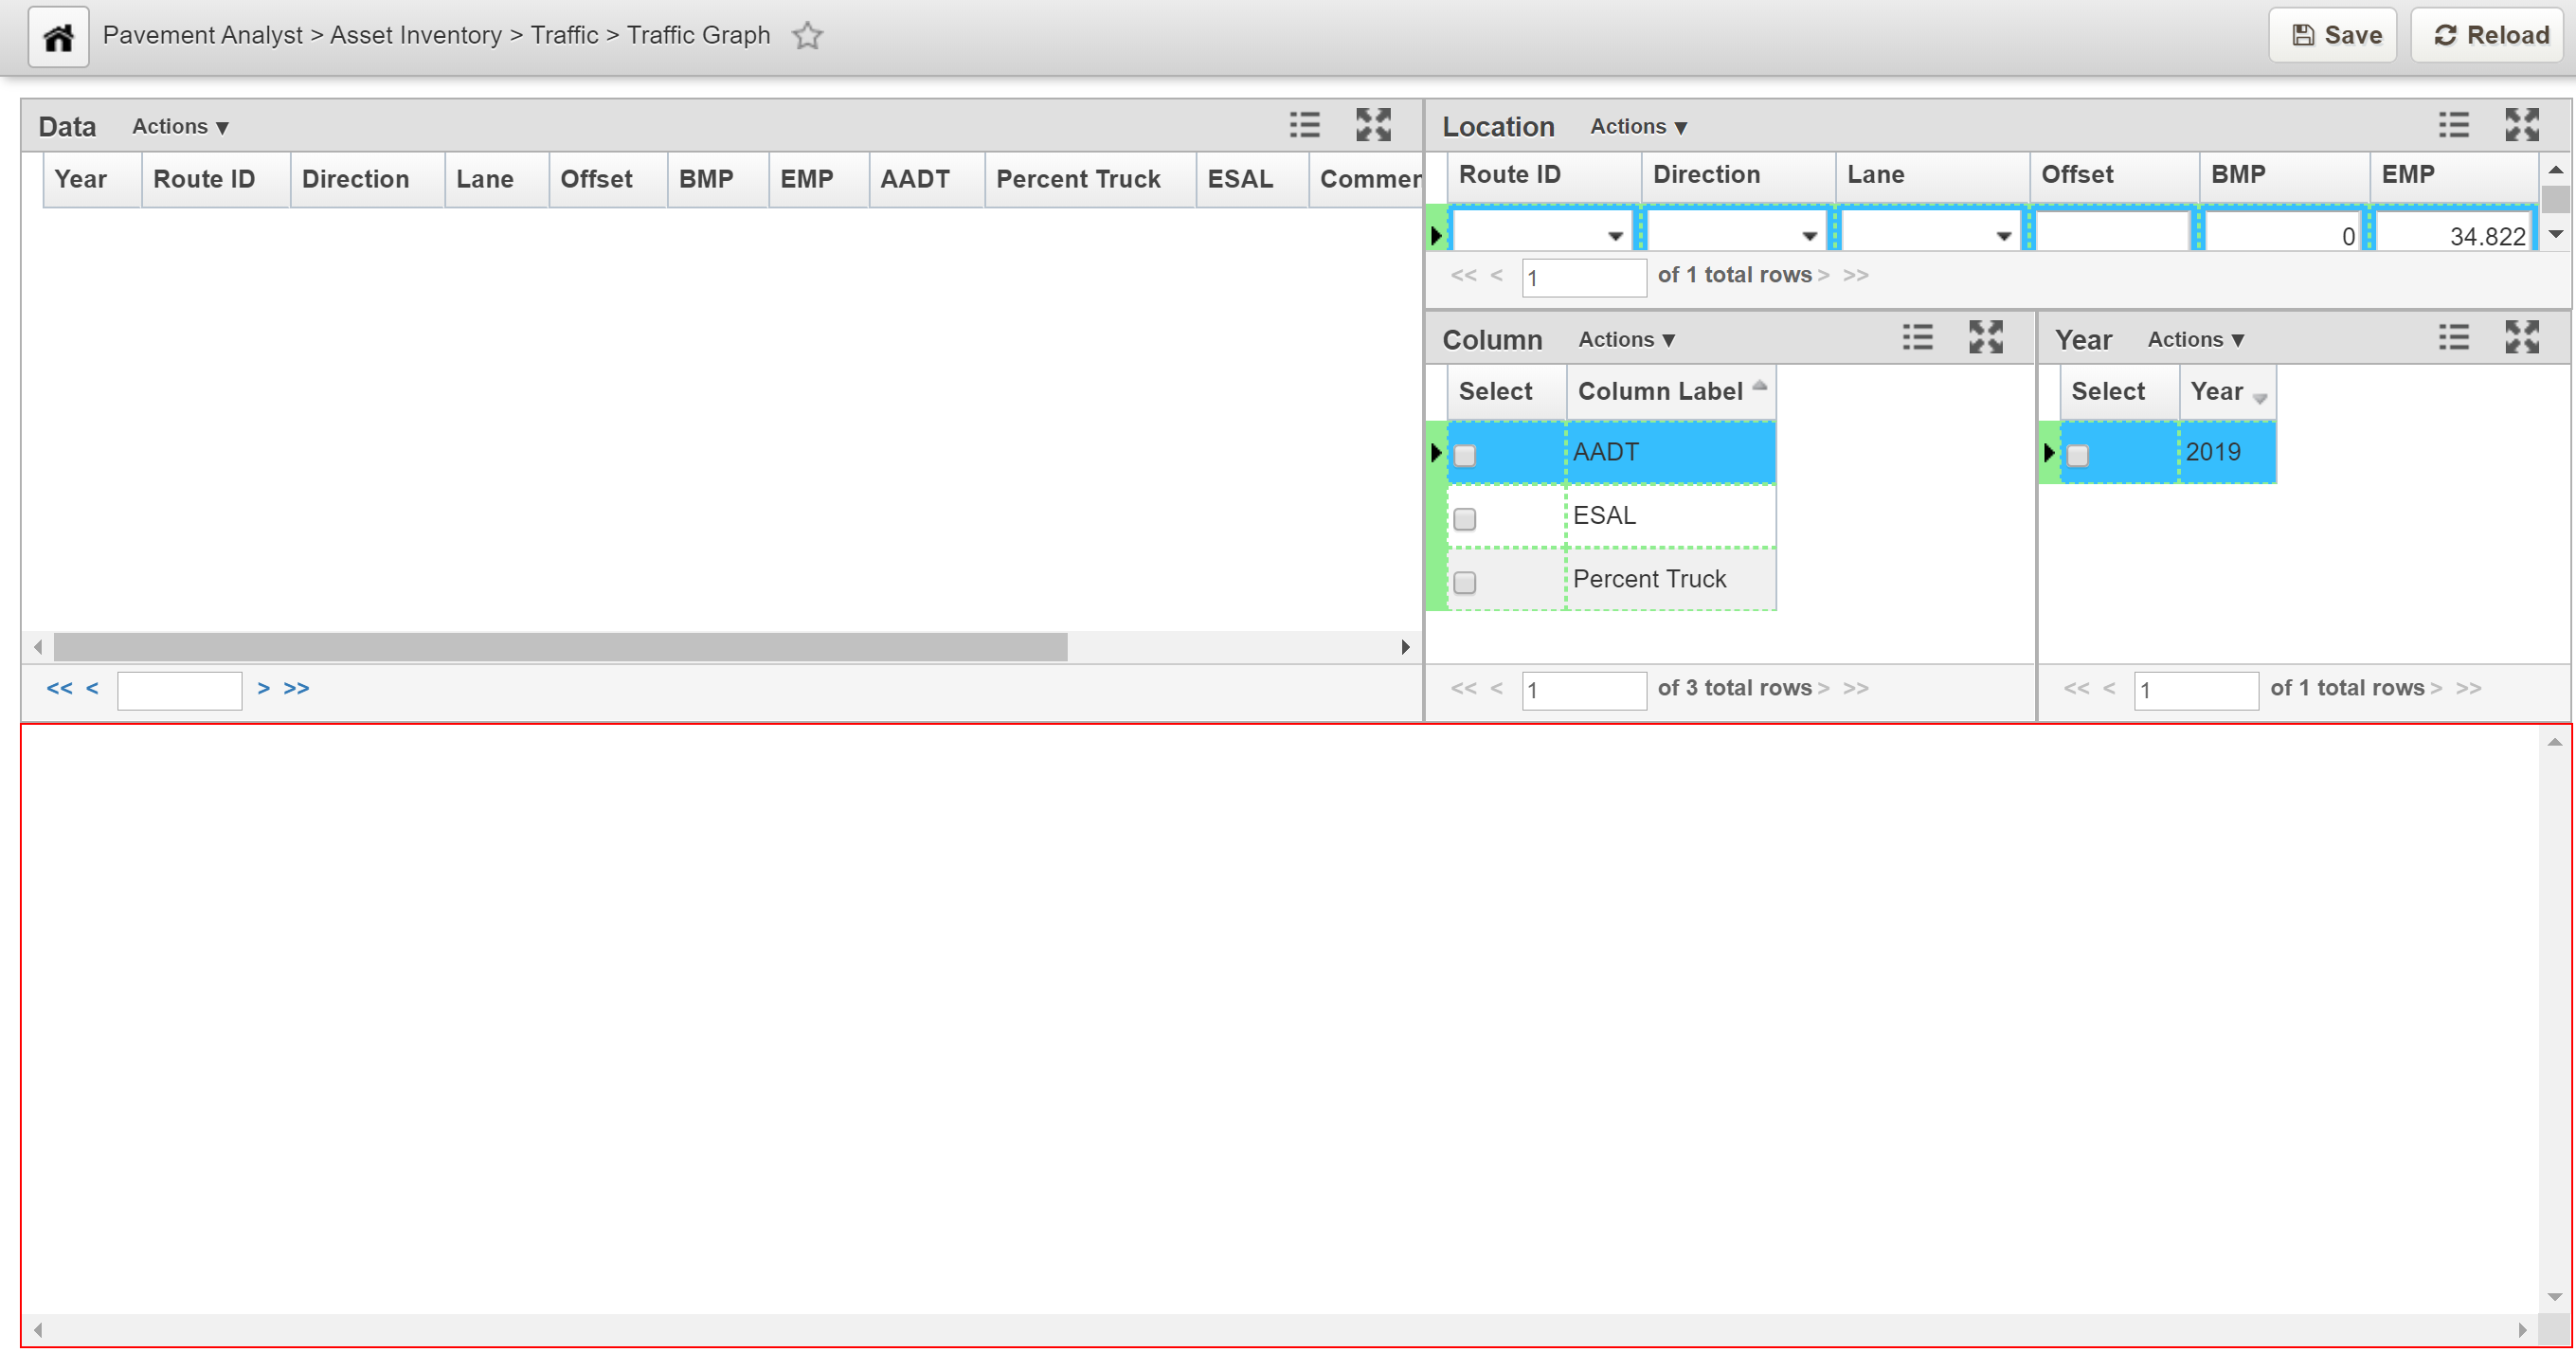
- In the Pavement module, navigate to: Pavement Analyst > Asset Inventory > Traffic > Traffic Graph
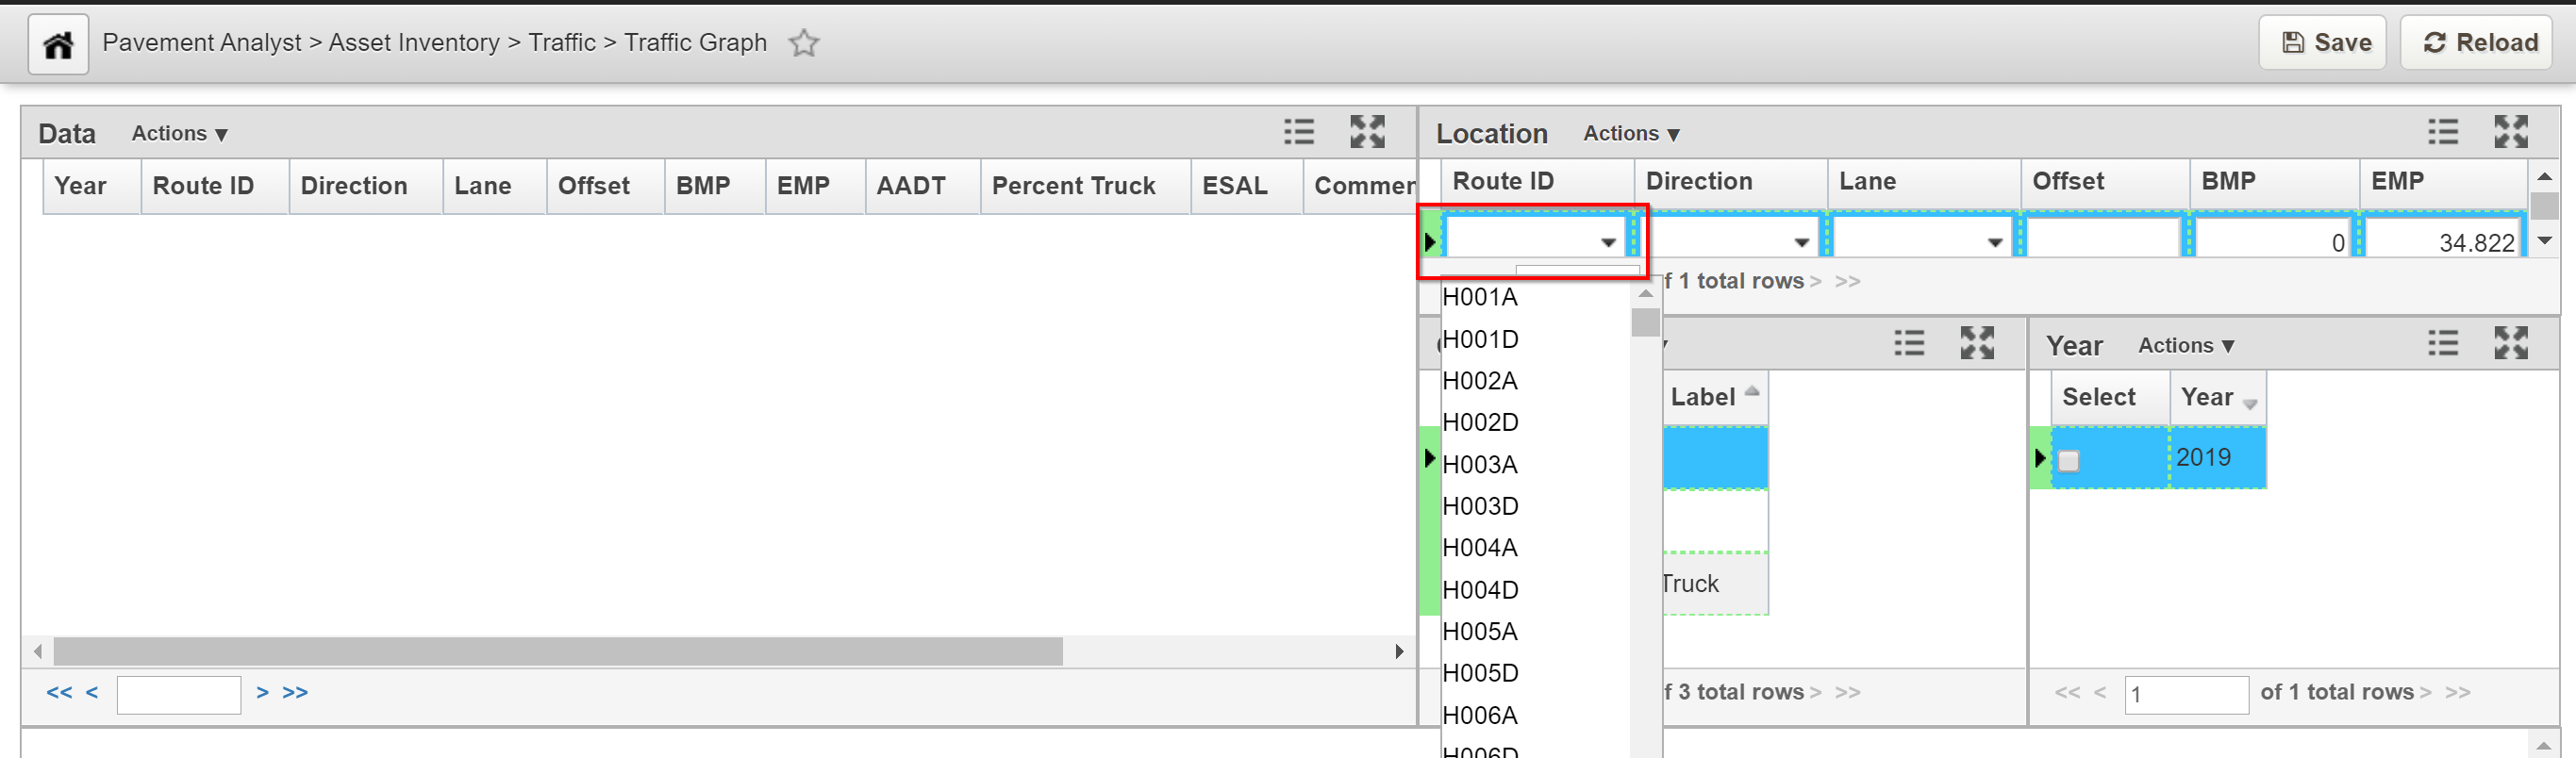
- Click the Route drop-down and choose a route of interest
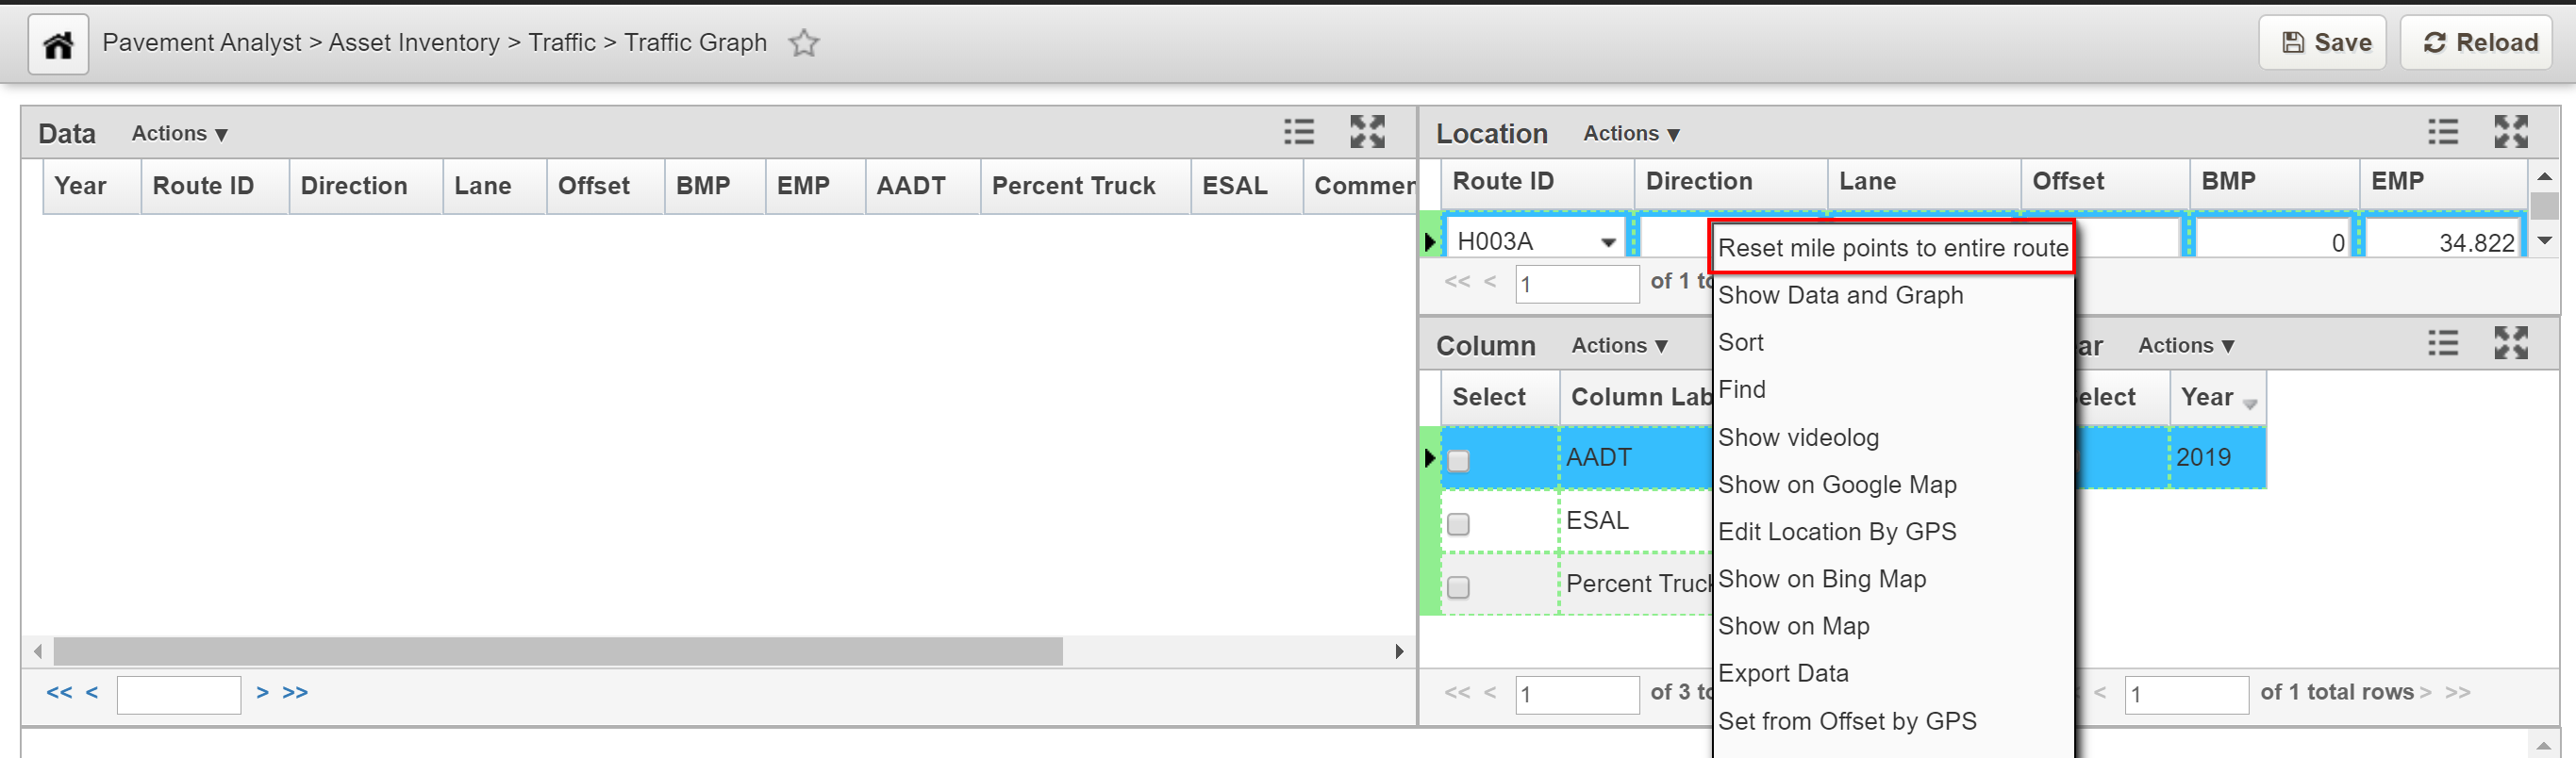
- Right-click on the row and select Reset mile points to entire route. The system populates the Begin Mile and End Mile columns
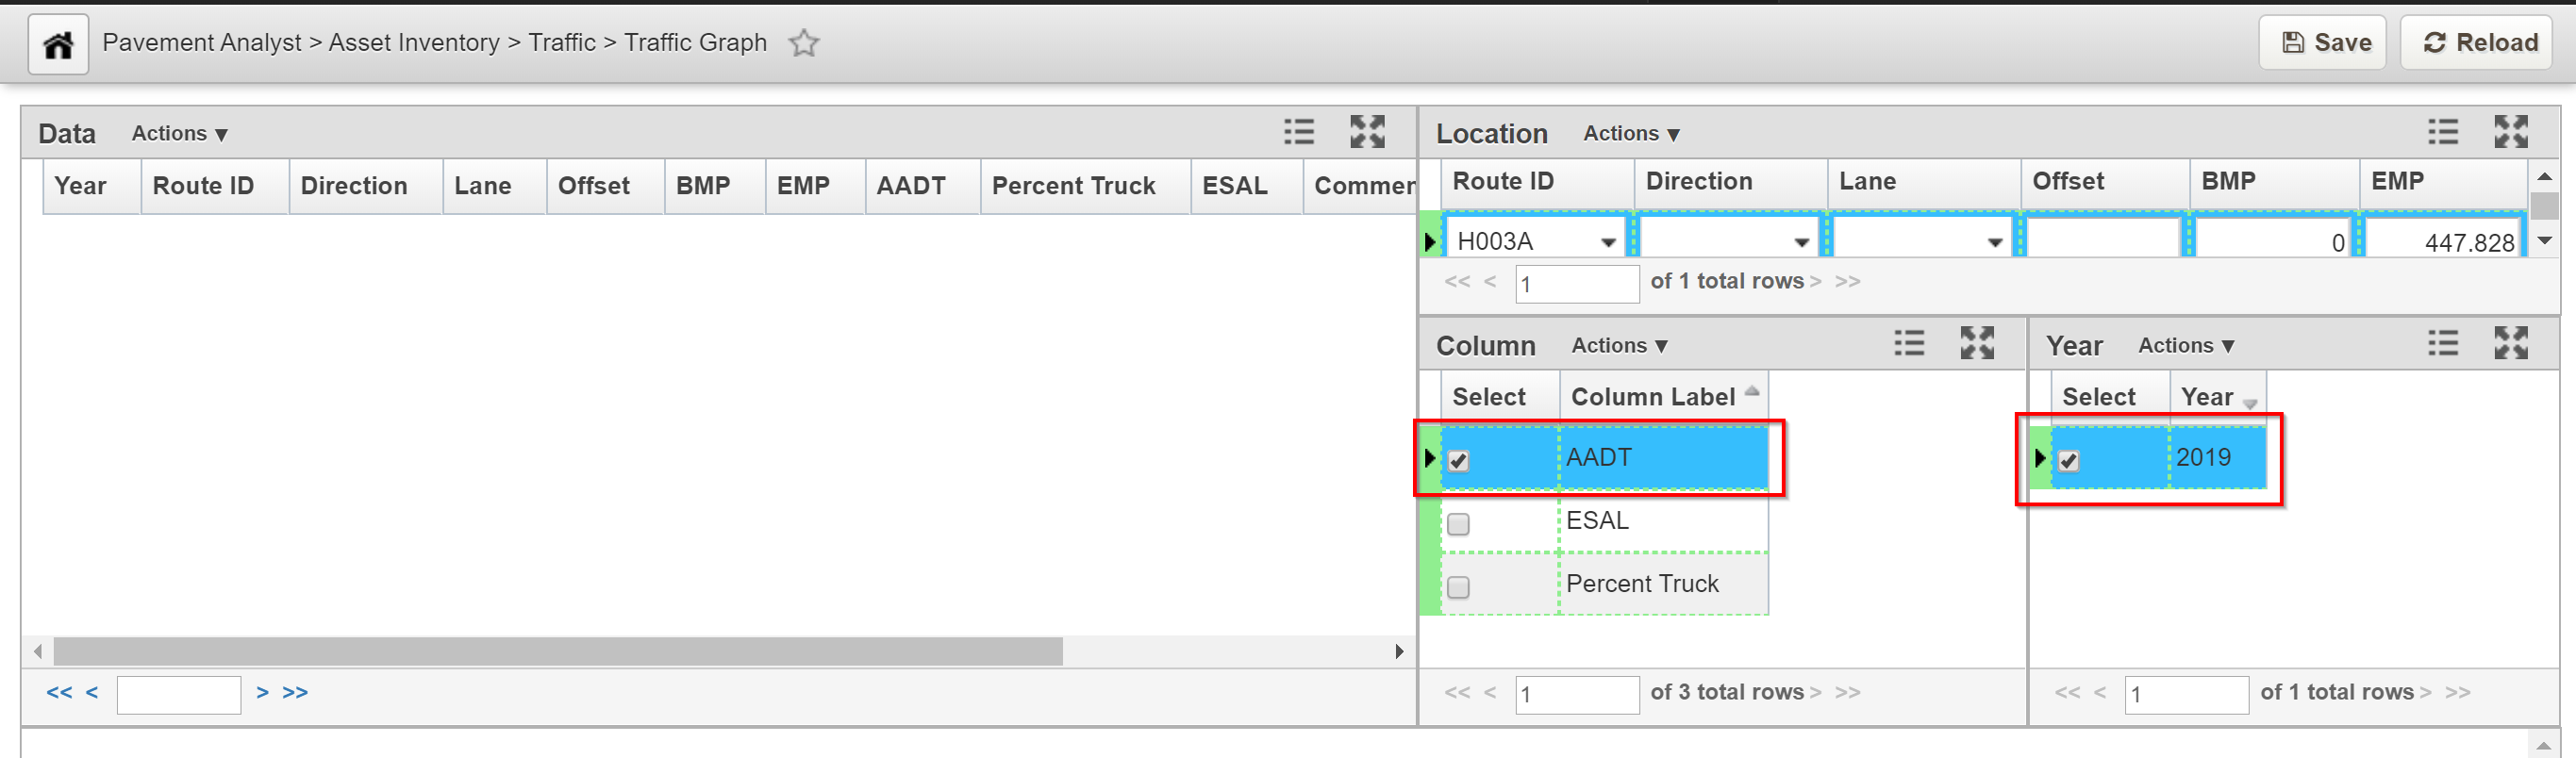
- In the Column pane, Choose the Column Label by clicking the check-box adjacent to the label of interest
- In the Year pane, choose the Year by clicking the check-box adjacent to the year of interest
- Right-click in the Location pane again and select Show Data and Graph.
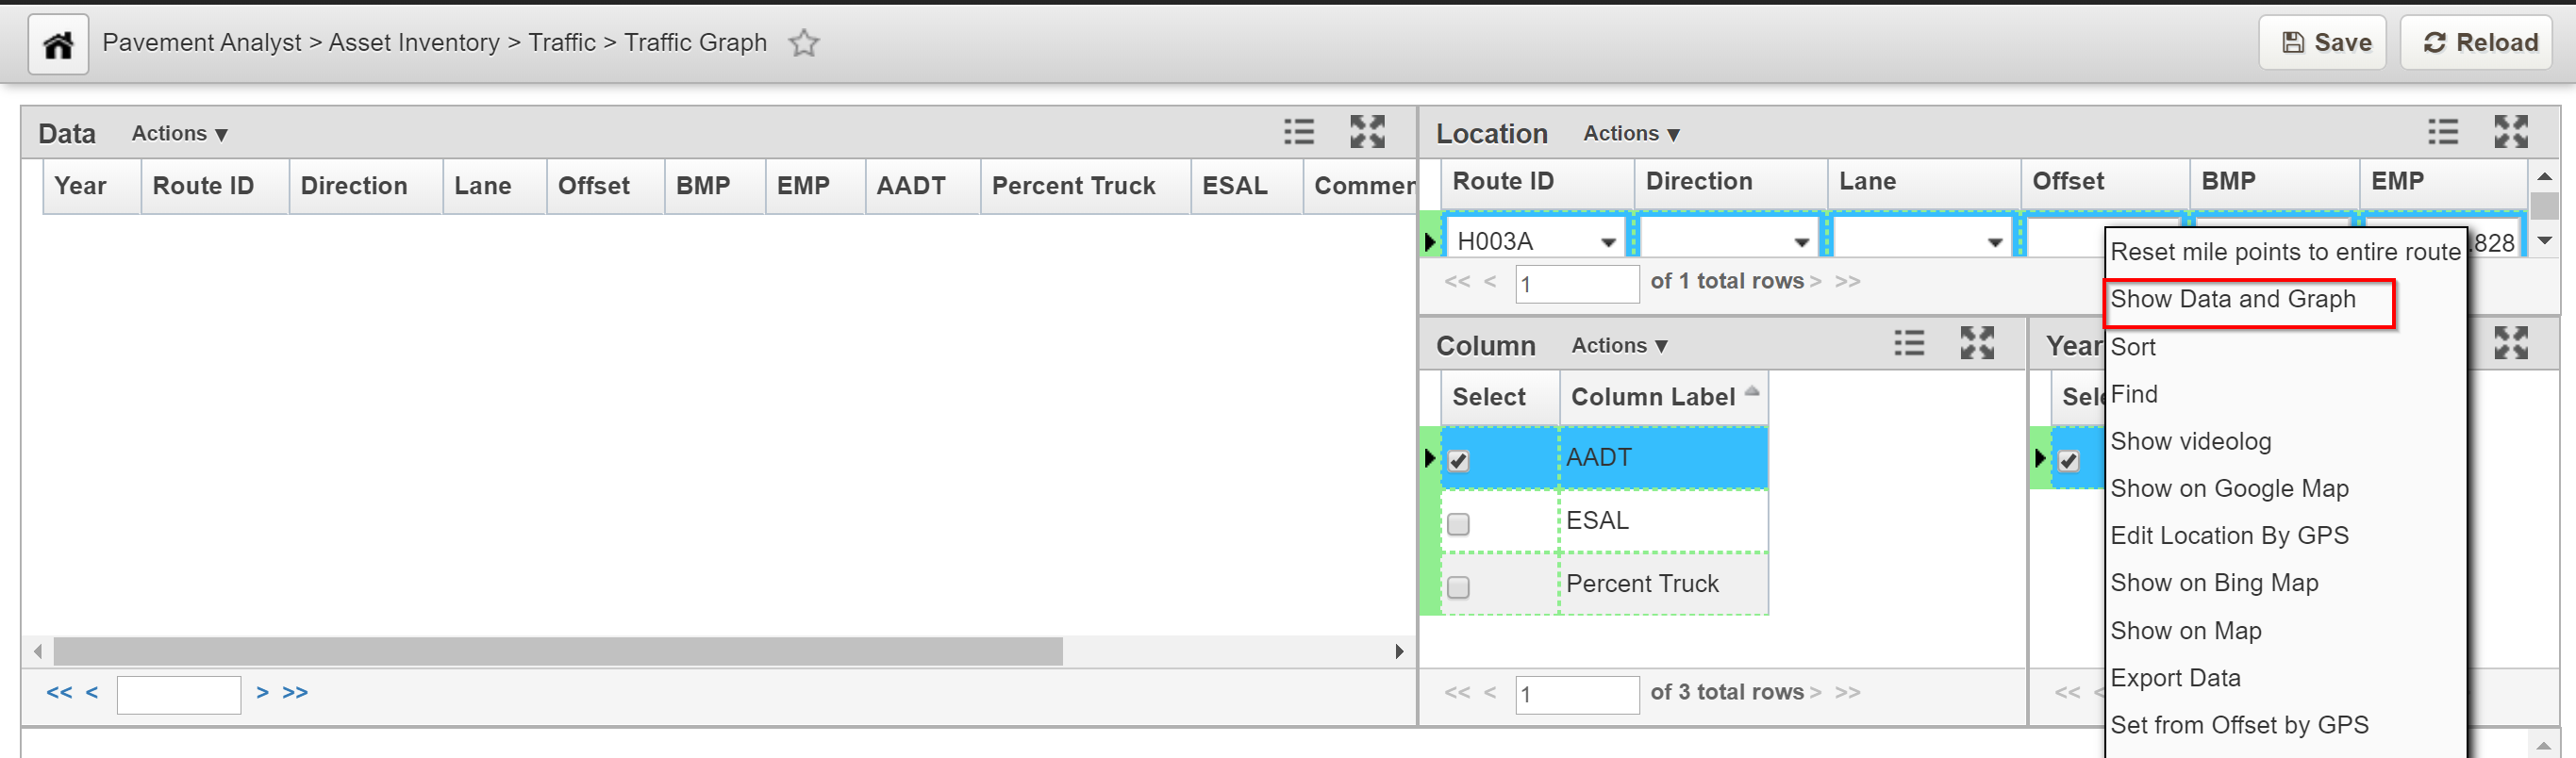
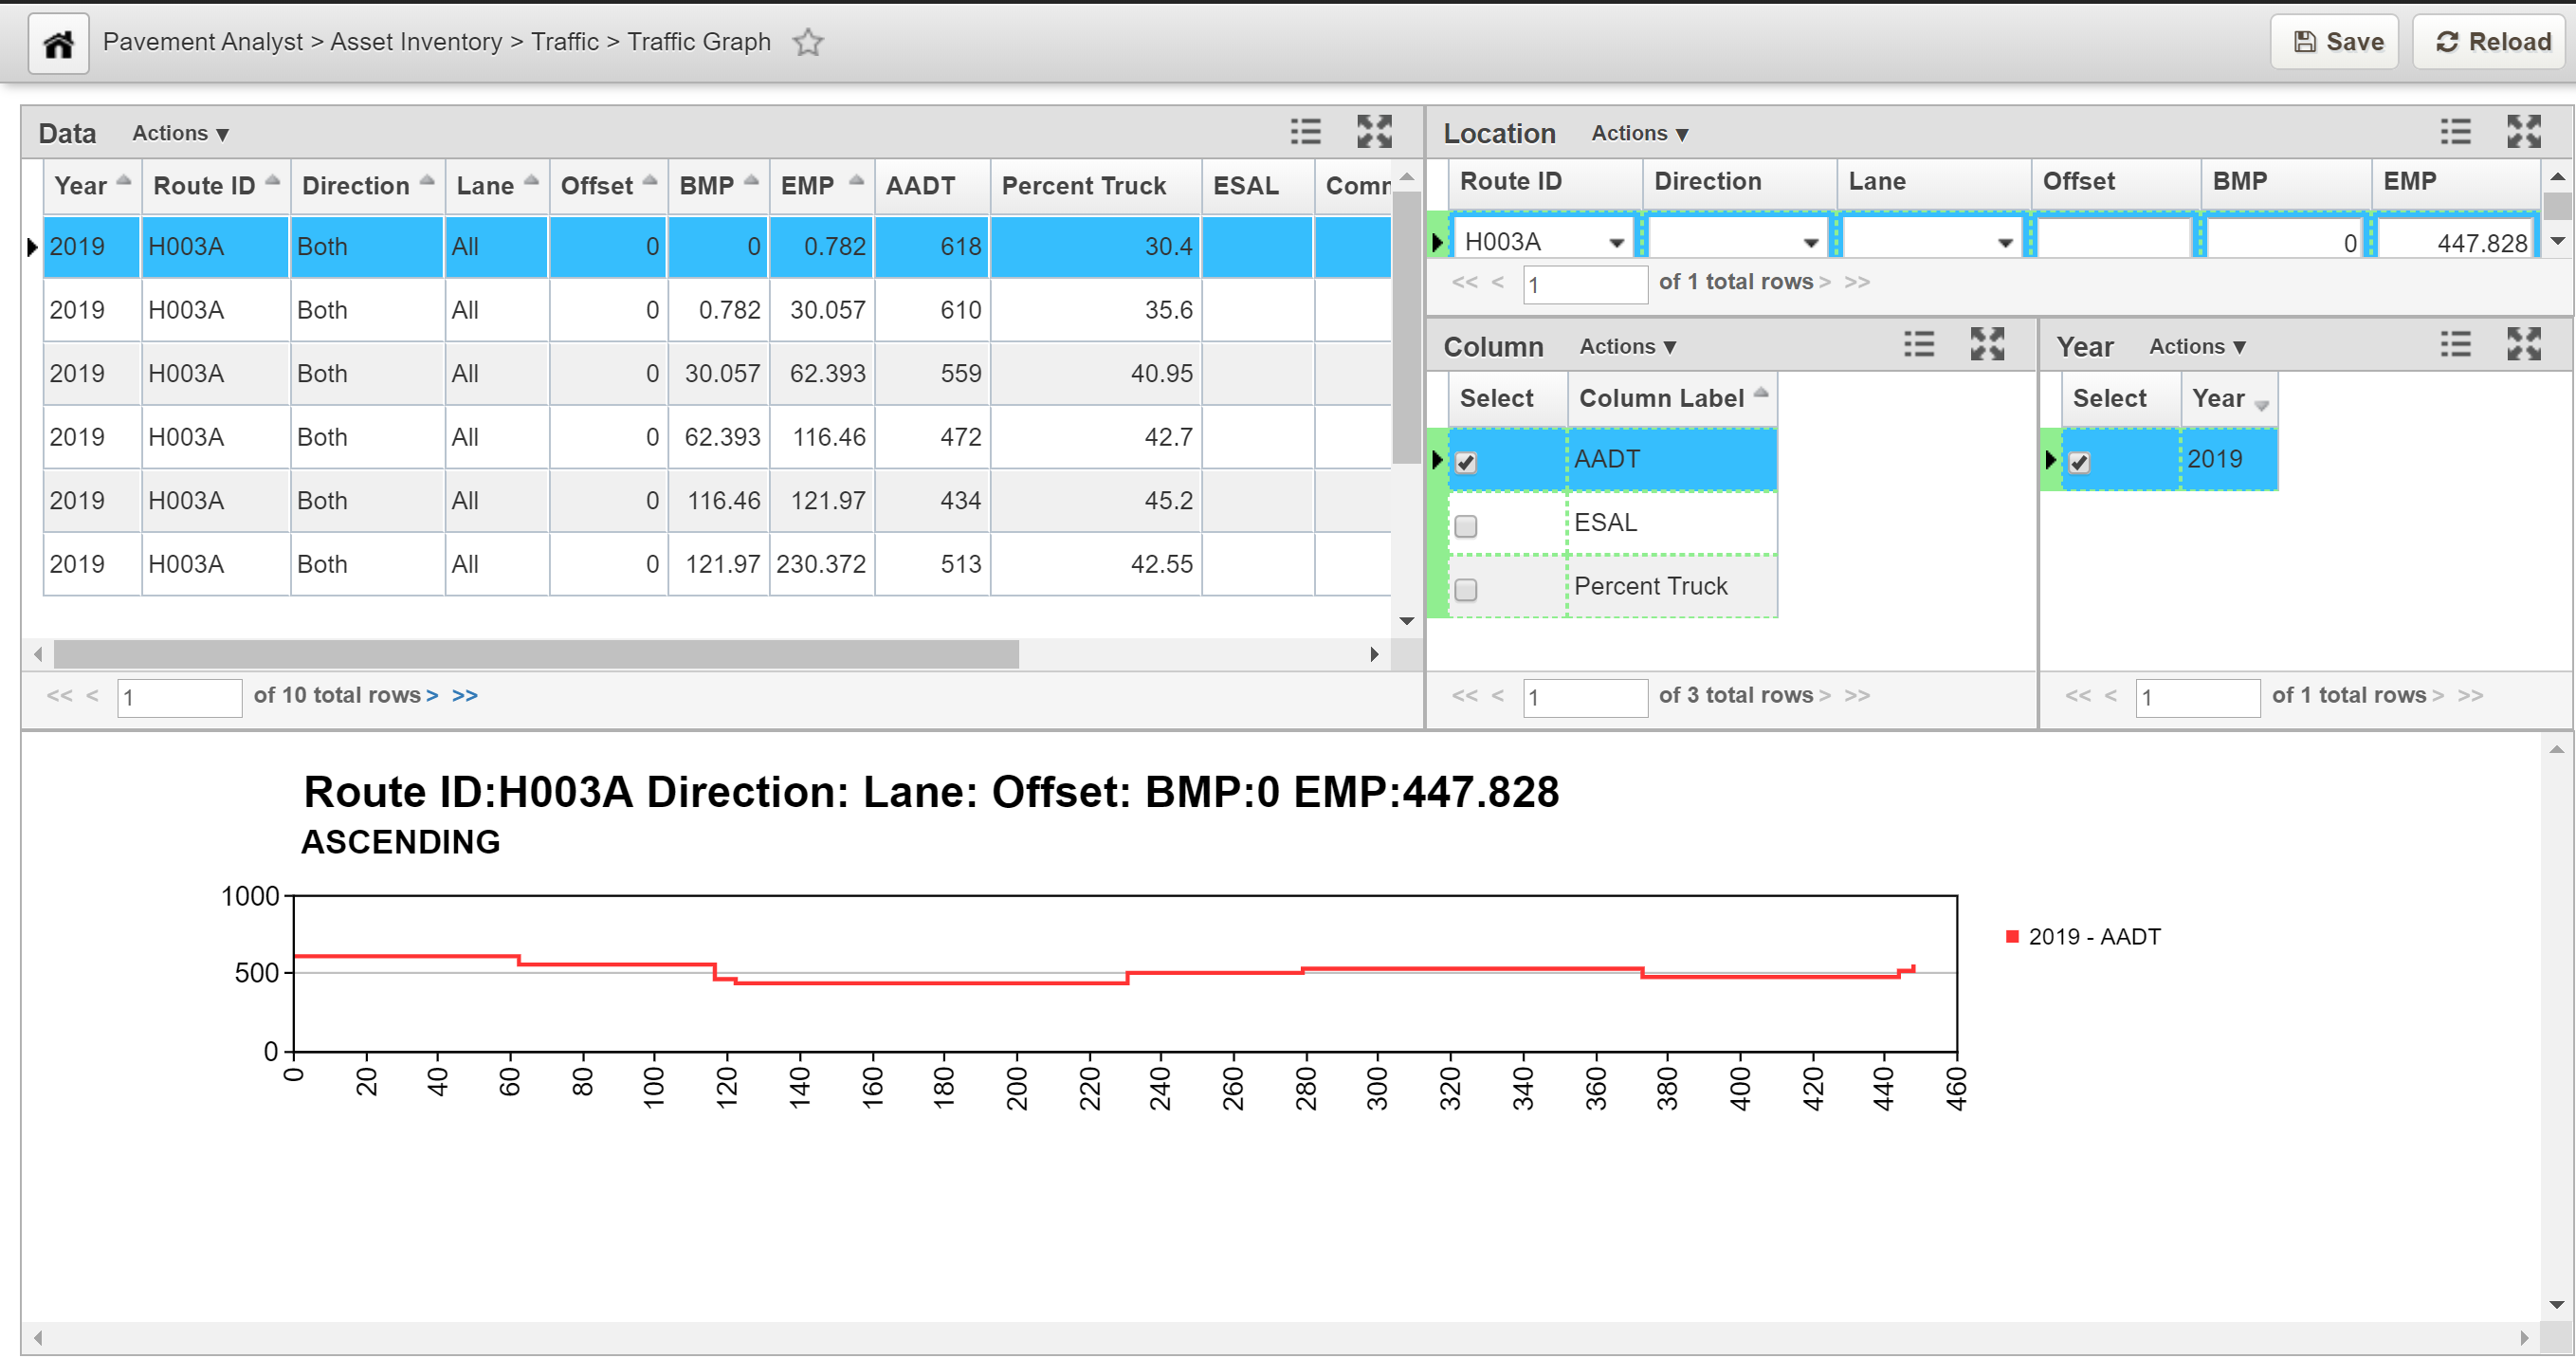
- The system generates and displays the data based on the selection that were made
...