Dynamic aggregation aggregates road sections so that the resulting sections are all the same for a particular data parameter according to the rules configured in the Setup Dynamic Aggregation window. Once a dynamic aggregation rule set has been created in the Setup Dynamic Aggregation window, the aggregated output table can be refreshed at any time using the Dynamic Aggregation window.
For example, if traffic volumes are collected along a route as shown below:
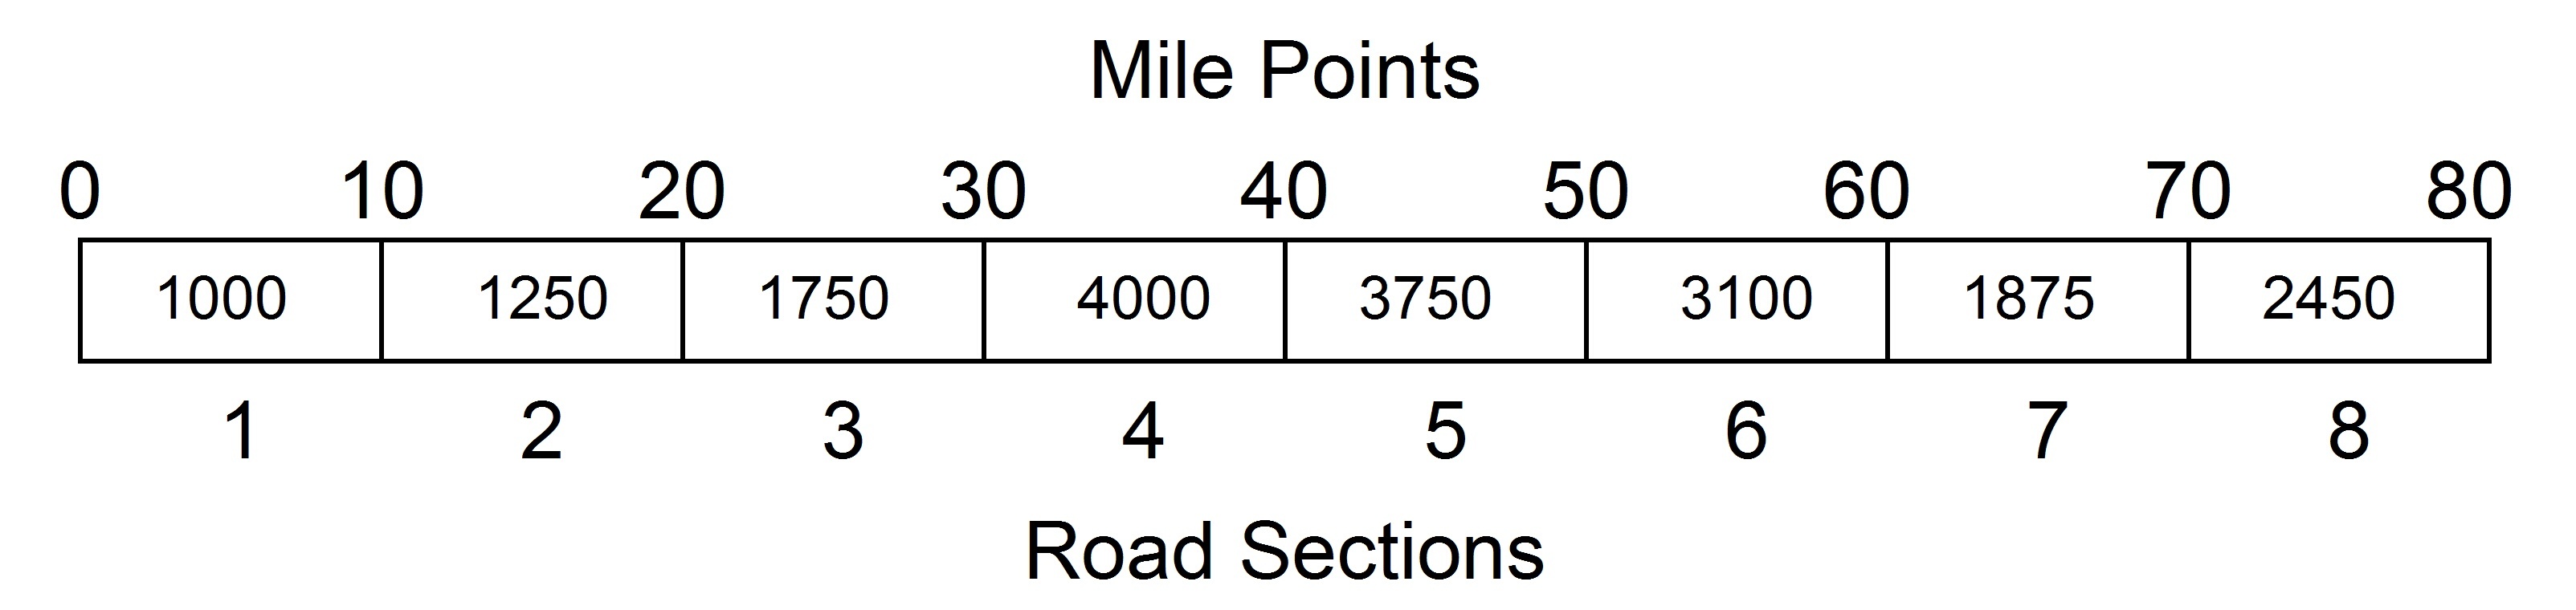
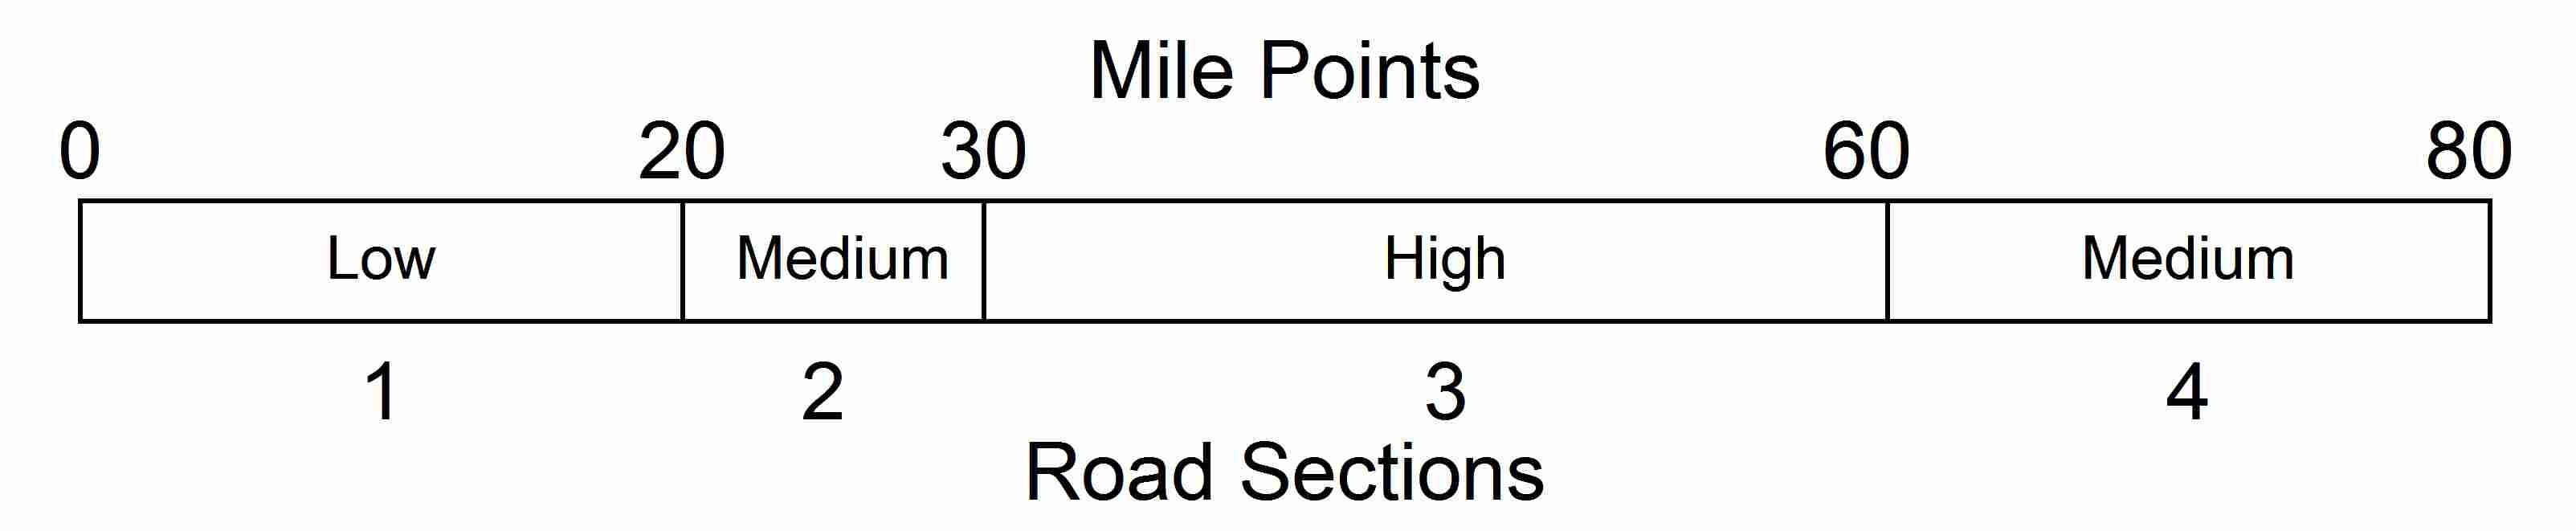
You could aggregate these different volumes into three categories: low (less than 1500), medium (1500 to 2500), and high (greater than 2500). Using dynamic aggregation, the eight road sections of the route would be aggregated into four sections as shown below:
The first step in using the Dynamic Aggregation window is to choose one of the Aggregation rule sets from the drop-down list shown in the top left corner of the window. After this, all further activity in this window is applicable only to this selected dynamic aggregation operation. This activity includes:
- Viewing the results of the dynamic aggregation operation graphically and literally without affecting the output file.
- If needed, making manual adjustments to the results.
- When the results are as desired, sending them to the output file.
The Dynamic Aggregation window contains the following panes: Route Selection, Segment Boundaries, Columns to Graph, and the Graph. It also contains a drop-down list of Aggregation Rules and the following buttons that provide functionality for the selected dynamic aggregation operation:
- Show Graph: This button displays or refreshes the graph shown at the bottom of the window.
- Do Aggregation: This button performs the dynamic aggregation operation on the set of road segments as constrained by any filtering. The output is placed in a temporary table, which is displayed in the Graph pane and the Segment Boundary pane. If desired, the output can be adjusted in the Segment Boundary pane.
After the dynamic aggregation operation is performed, the Graph pane is refreshed. The prerequisites to display a graph in the Graph pane are: (1) select one or more columns in the Columns to Graph pane; and (2) have just previously clicked the Do Aggregation button for the currently selected dynamic aggregation operation.
- Move Data: This button becomes available after selecting the Do Aggregation button (which places data in the temporary table). It replaces the contents of the output table with the contents of the temporary table for all road segments as constrained by any filtering that may have been set.