The Optimization Analysis window is where all optimizations are performed. In this window you can define and run multiple optimizations, each having different settings, budgets, and analysis periods. The results from each optimization are stored separately and can be reviewed in this and other windows throughout the system.
Window Path: Pavement Analyst Express > Analysis > Network Analysis > Optimization Analysis
The window provides the following tabs that allow you to switch between different components of project optimization
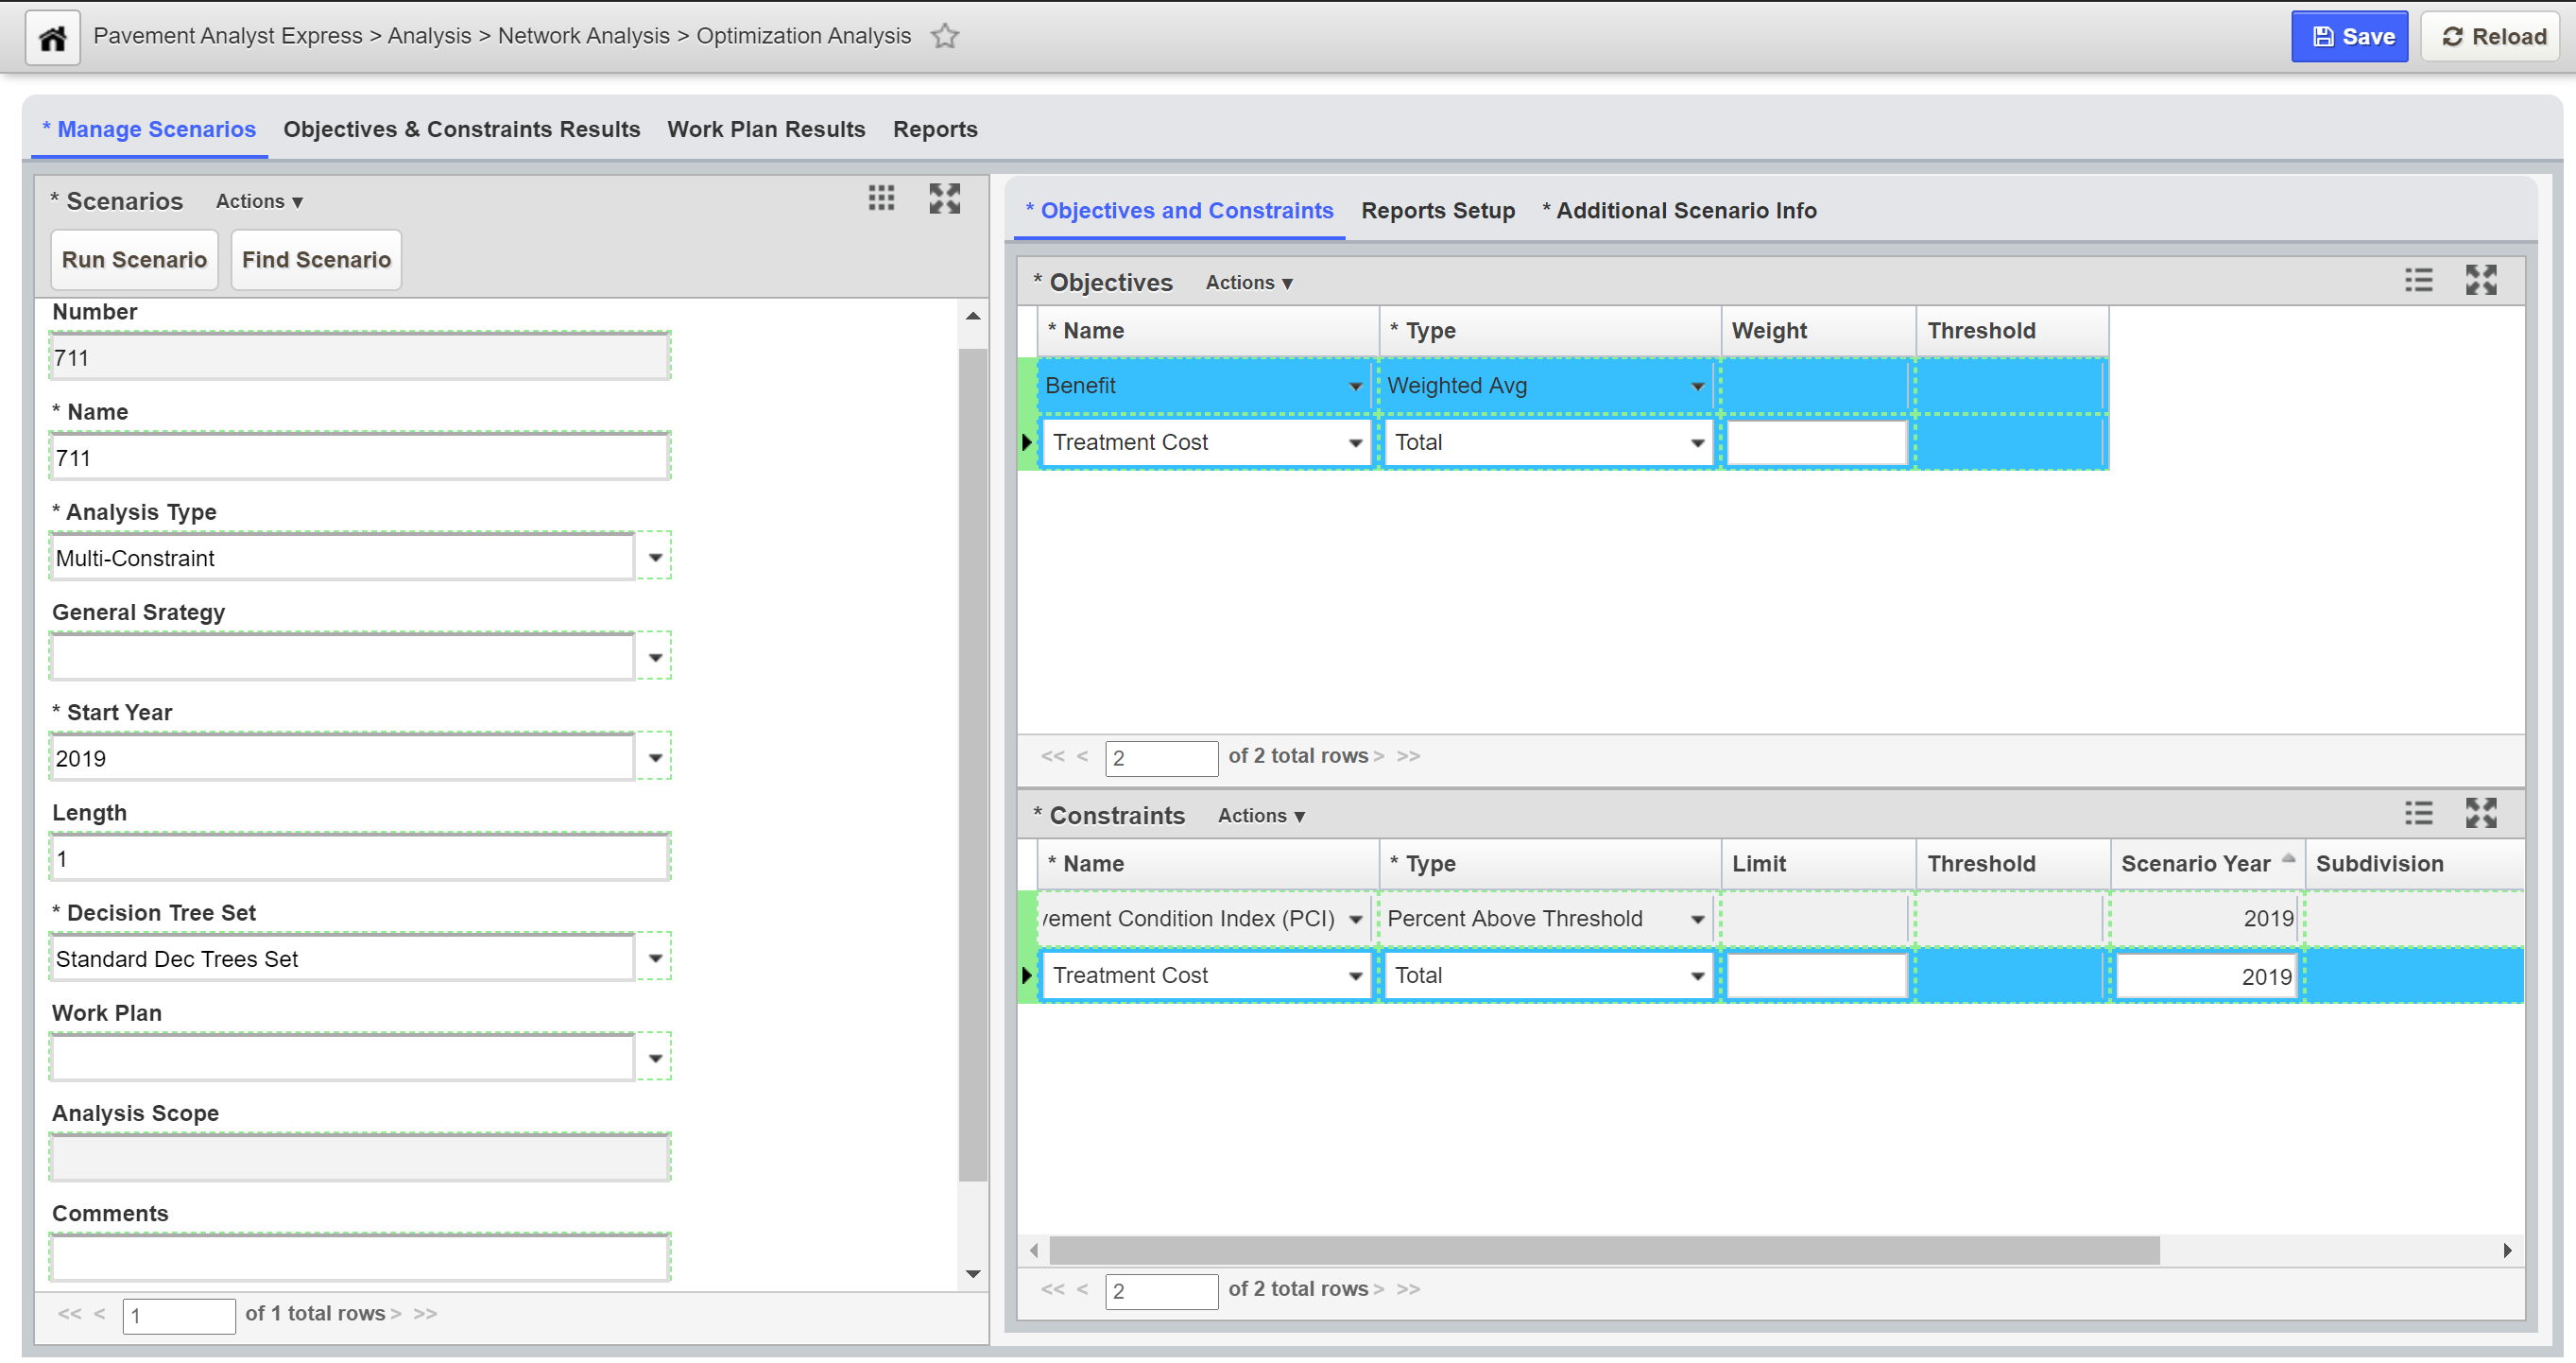
- Manage Scenarios: This tab is where all parameters for an optimization are established.
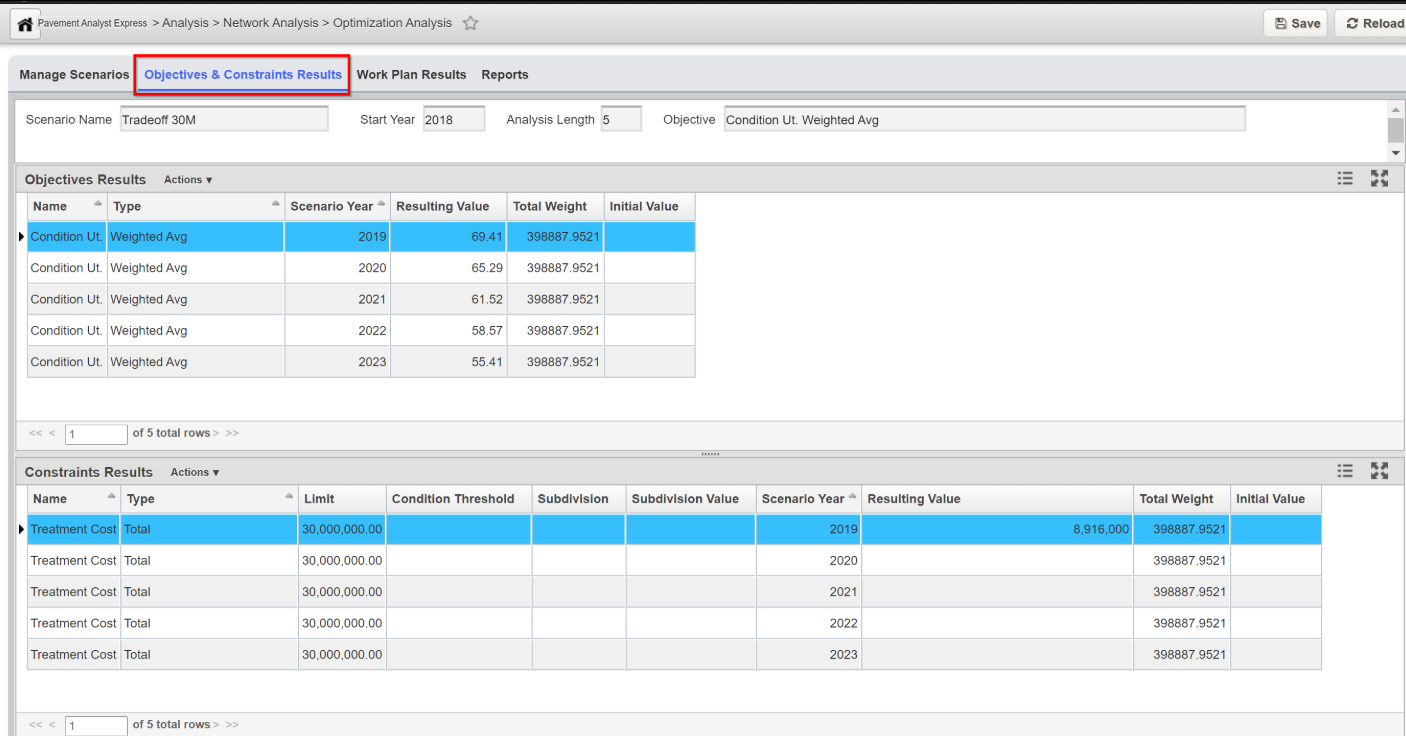
- Objectives & Constaints Results: This tab provides the result lists for the scenario. The Objective Results pane shows the selected objective for the scenario year. The Constraints Results pane shows the predicted values of each constraint compared to the input constraint value.
- Work Plan Results: This tab shows the constraints you selected in the Reporting Functions pane of the Setup tab and the values of the constraints.
- Reports; This tab shows the constraints you selected in the Reporting Functions pane of the Setup tab and the values of the constraints.
Note:
Note: Not all fields may show up in a specific implementation.
Objectives & Constraints Results
The Objective & Constraints Results tab of the Optimization Analysis window provides the result lists for the scenario. The Objective Results pane shows the selected objective for the scenario year. The Constraints Results pane shows the predicted values of each constraint compared to the input constraint value. This allows you to identify the constraints that have controlled the analysis results.
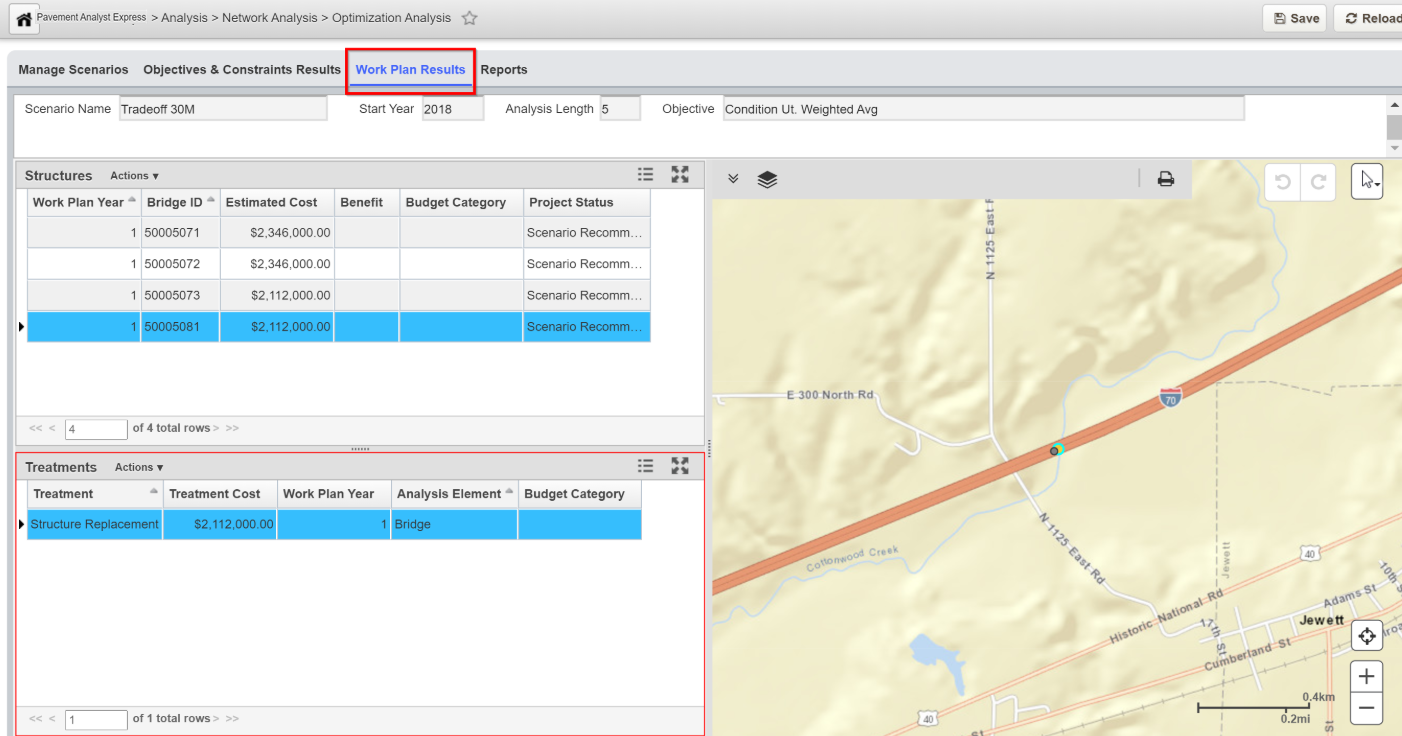
Work Plan Results Tab
The Work Plan Results tab of the Optimization Analysis window provides a list of work plans produced by the optimization routine, based upon the input criteria configured in the Setup tab.
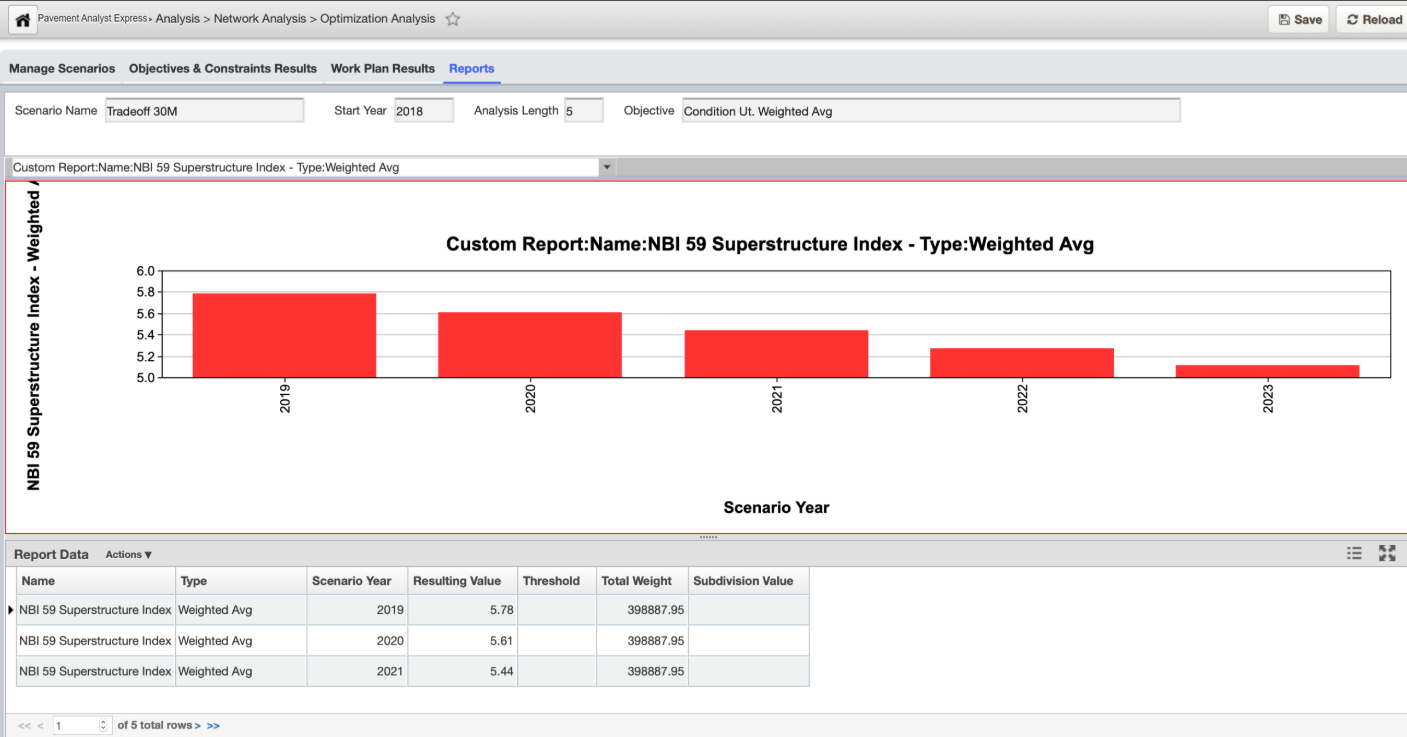
Reports Tab
The Report tab of the Optimization Analysis window shows the constraints you selected in the Reporting Functions pane of the Setup tab and the values of the constraints.
The right pane shows a graph of the values of a particular constraint (which is selected from the drop-down list field shown at the top of the pane). The Y-axis of the graph shows constraint values and the X-axis shows the number of years in the analysis. The graph is a line graph for all constraint types except Total, which is a bar graph. You may modify the appearance of the graph by using the right-click Change Graph Properties commands.